User’s guide to Argus
What is Argus?
Argus is an alert aggregator designed for storing and managing alerts from different monitoring systems at one place. Argus is created for ease of alarm management via a personalized interface and customizable alarm notifications.
Log into Argus
Argus supports several login mechanisms:
username-password login
federated login with OAuth 2.0
Log in and start using Argus at /accounts/login.
Login using username and password
Fill out username and password.
Press
Log in.
Login using OAuth 2.0 (Feide in the example below)
Under “Login with” press
dataporten_feide.Select the account you want to log in with.
Fill out username and password and press
Log in.Continue with the preferred method for two-factor authentication.
Configure user settings
Open user menu
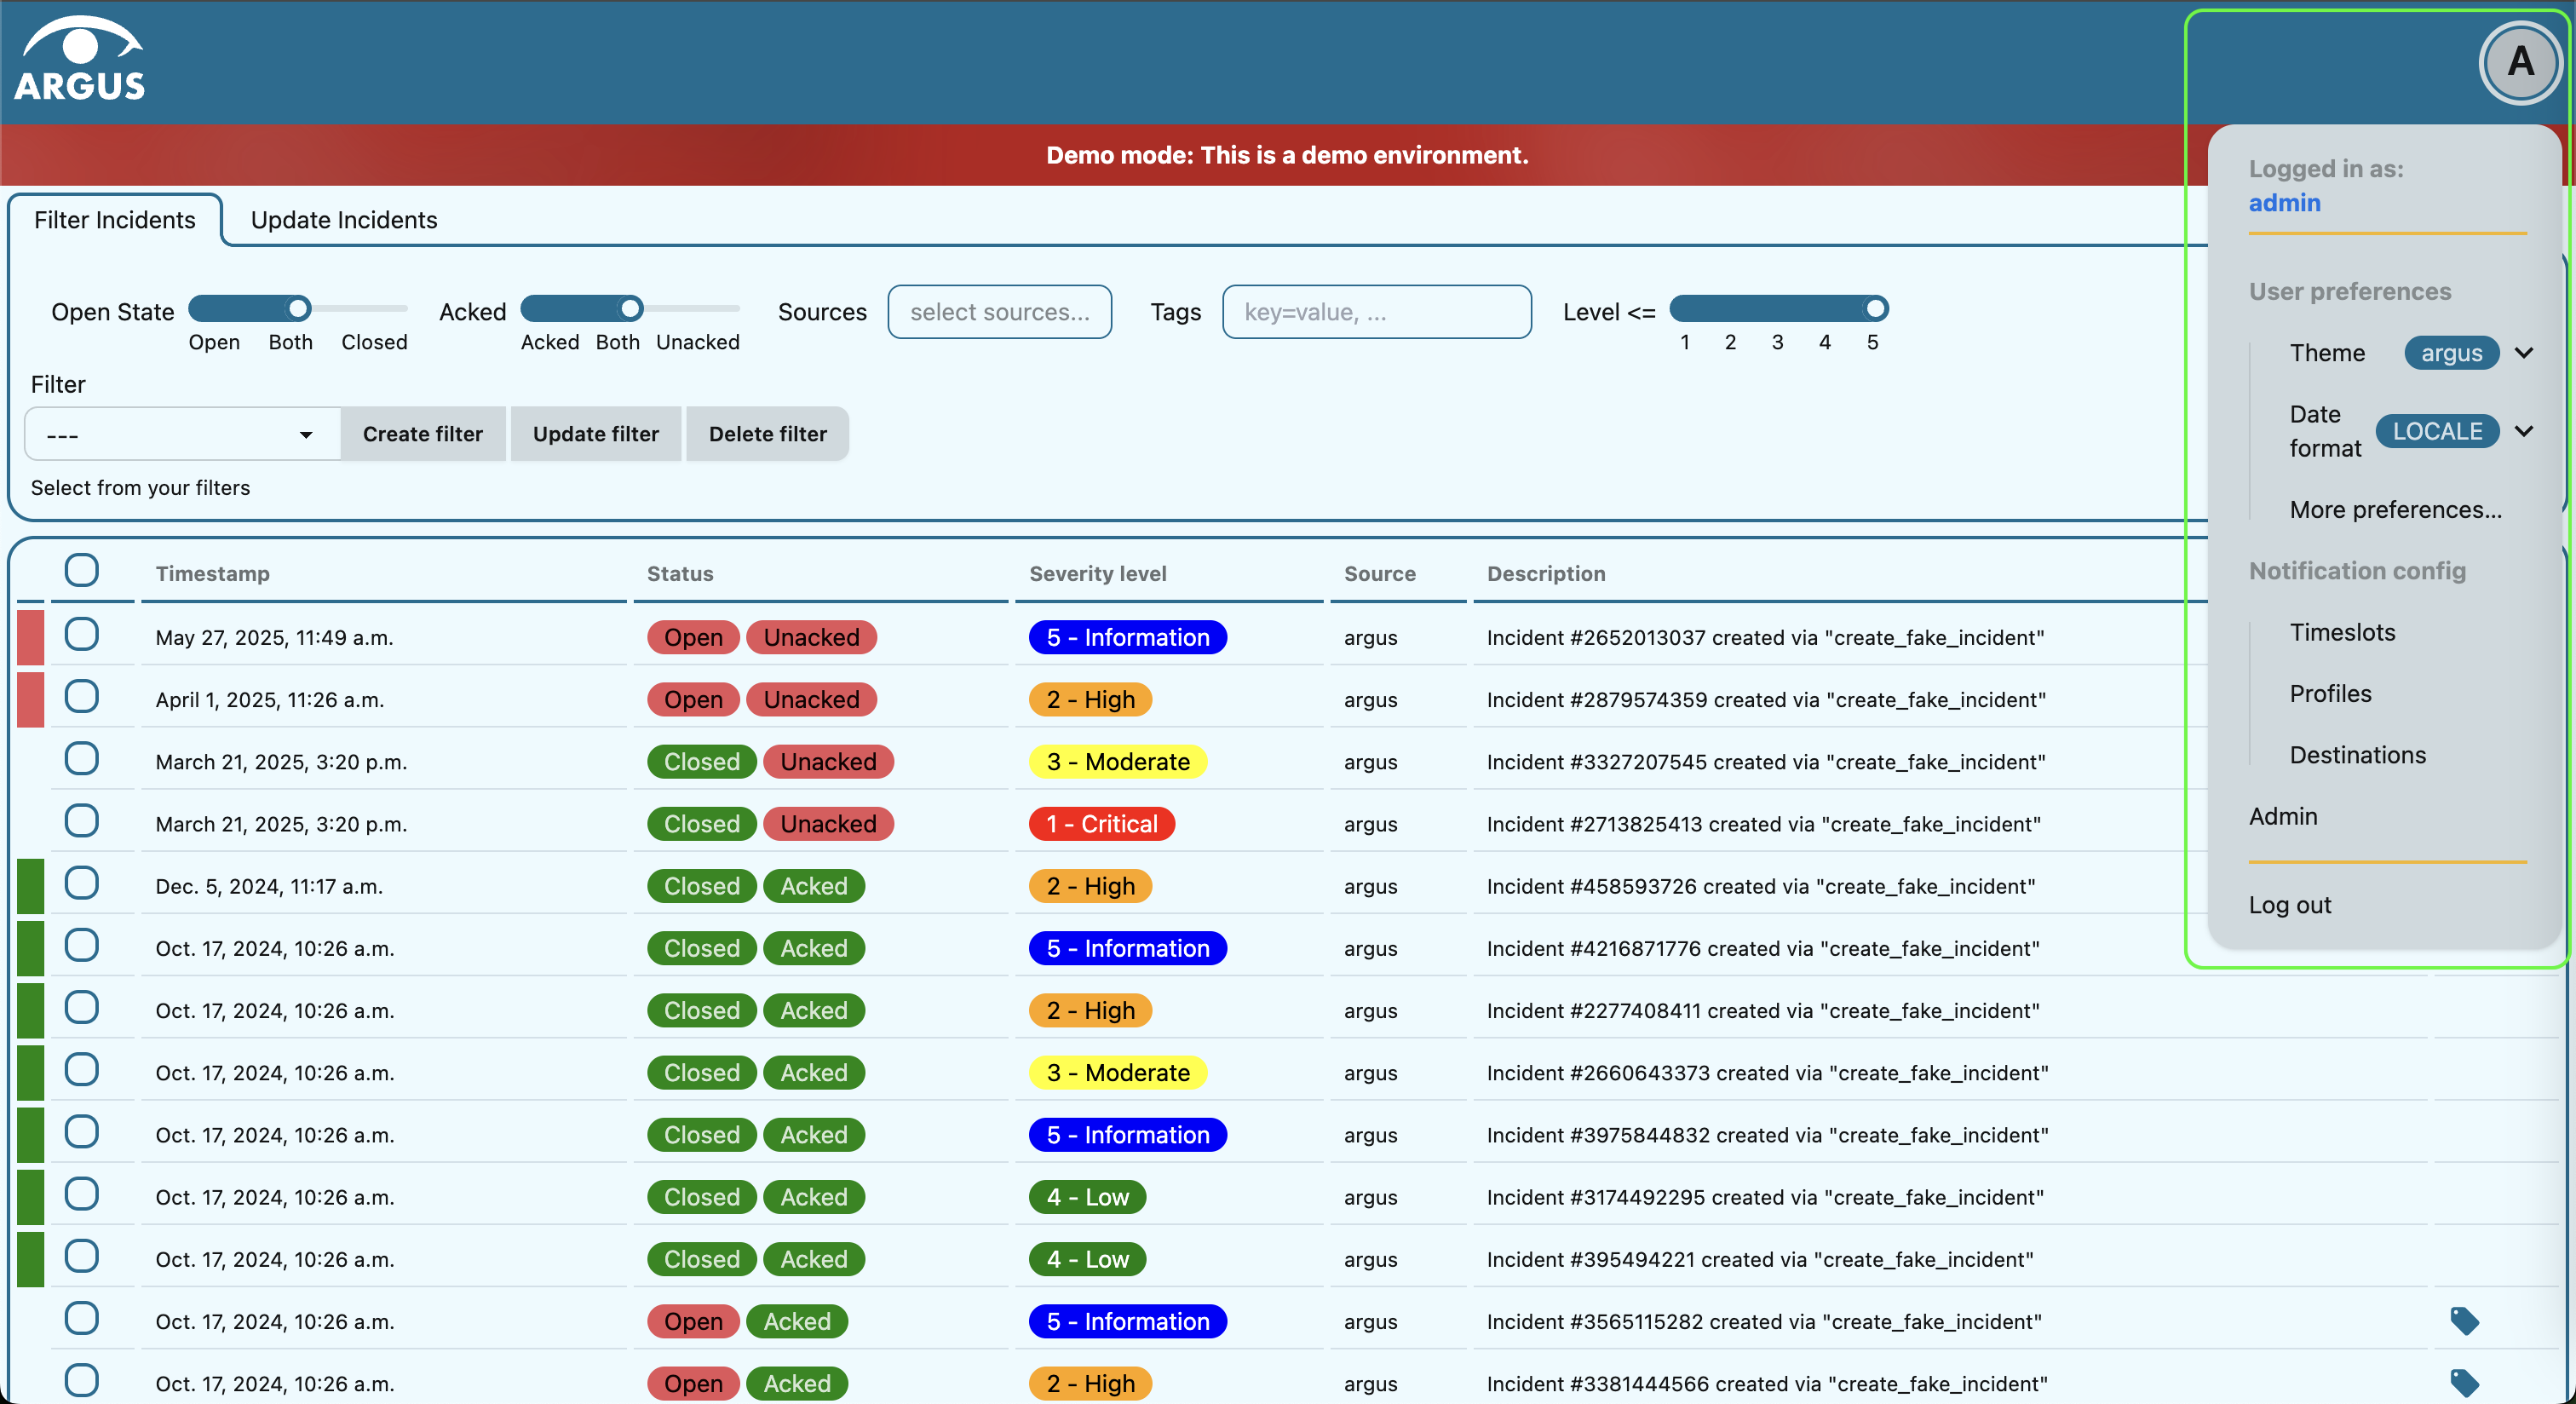
To open user menu, click on the user icon in the header:
Select theme
Click on the Theme drop-down in the User preferences section.
Select the preferred theme from the drop-down menu.
Add your own theme
There are three themes available out of the box in Argus: Argus, Dark and Light. You can add your own theme by overriding the default DAISYUI_THEMES. Talk to your system administrator if you want to add your own theme. You can either select from the available daisyUI themes, or create your own. For creating your own theme, we recommend using the daisyUI theme generator.
Choose what columns are shown in the incidents table
It is possible to add or remove columns in the Incidents table. Currently it is possible to customize columns only globally for all users of the same installation of Argus. Talk to your system administrator if you want to contribute to the customization of the Incidents table columns.
Change date and time format
Click on the Date format drop-down in the User preferences section.
Select the preferred date format from the drop-down menu. The date format will be applied to all dates in Argus. Available options are:
LOCALE- uses the date format of your browser locale.ISO- uses the ISO date format (YYYY-MM-DD HH:MM:SS).RFC- uses the RFC date format (Day, DD Mon YYYY HH:MM:SS GMT).EPOCH- uses the Unix epoch date format (seconds since 1970-01-01 00:00:00 UTC).
Work with alarms in Argus
View, filter and update alarms that come to Argus from different sources (monitoring systems).
You can see all of your monitoring systems that are connected to Argus in the Sources selector. Click on Sources in the Filter incidents tab and all available monitoring systems will appear in the drop-down menu.
What is an incident in Argus
An incident is an alarm that was sent to Argus from a monitoring system of your choice.
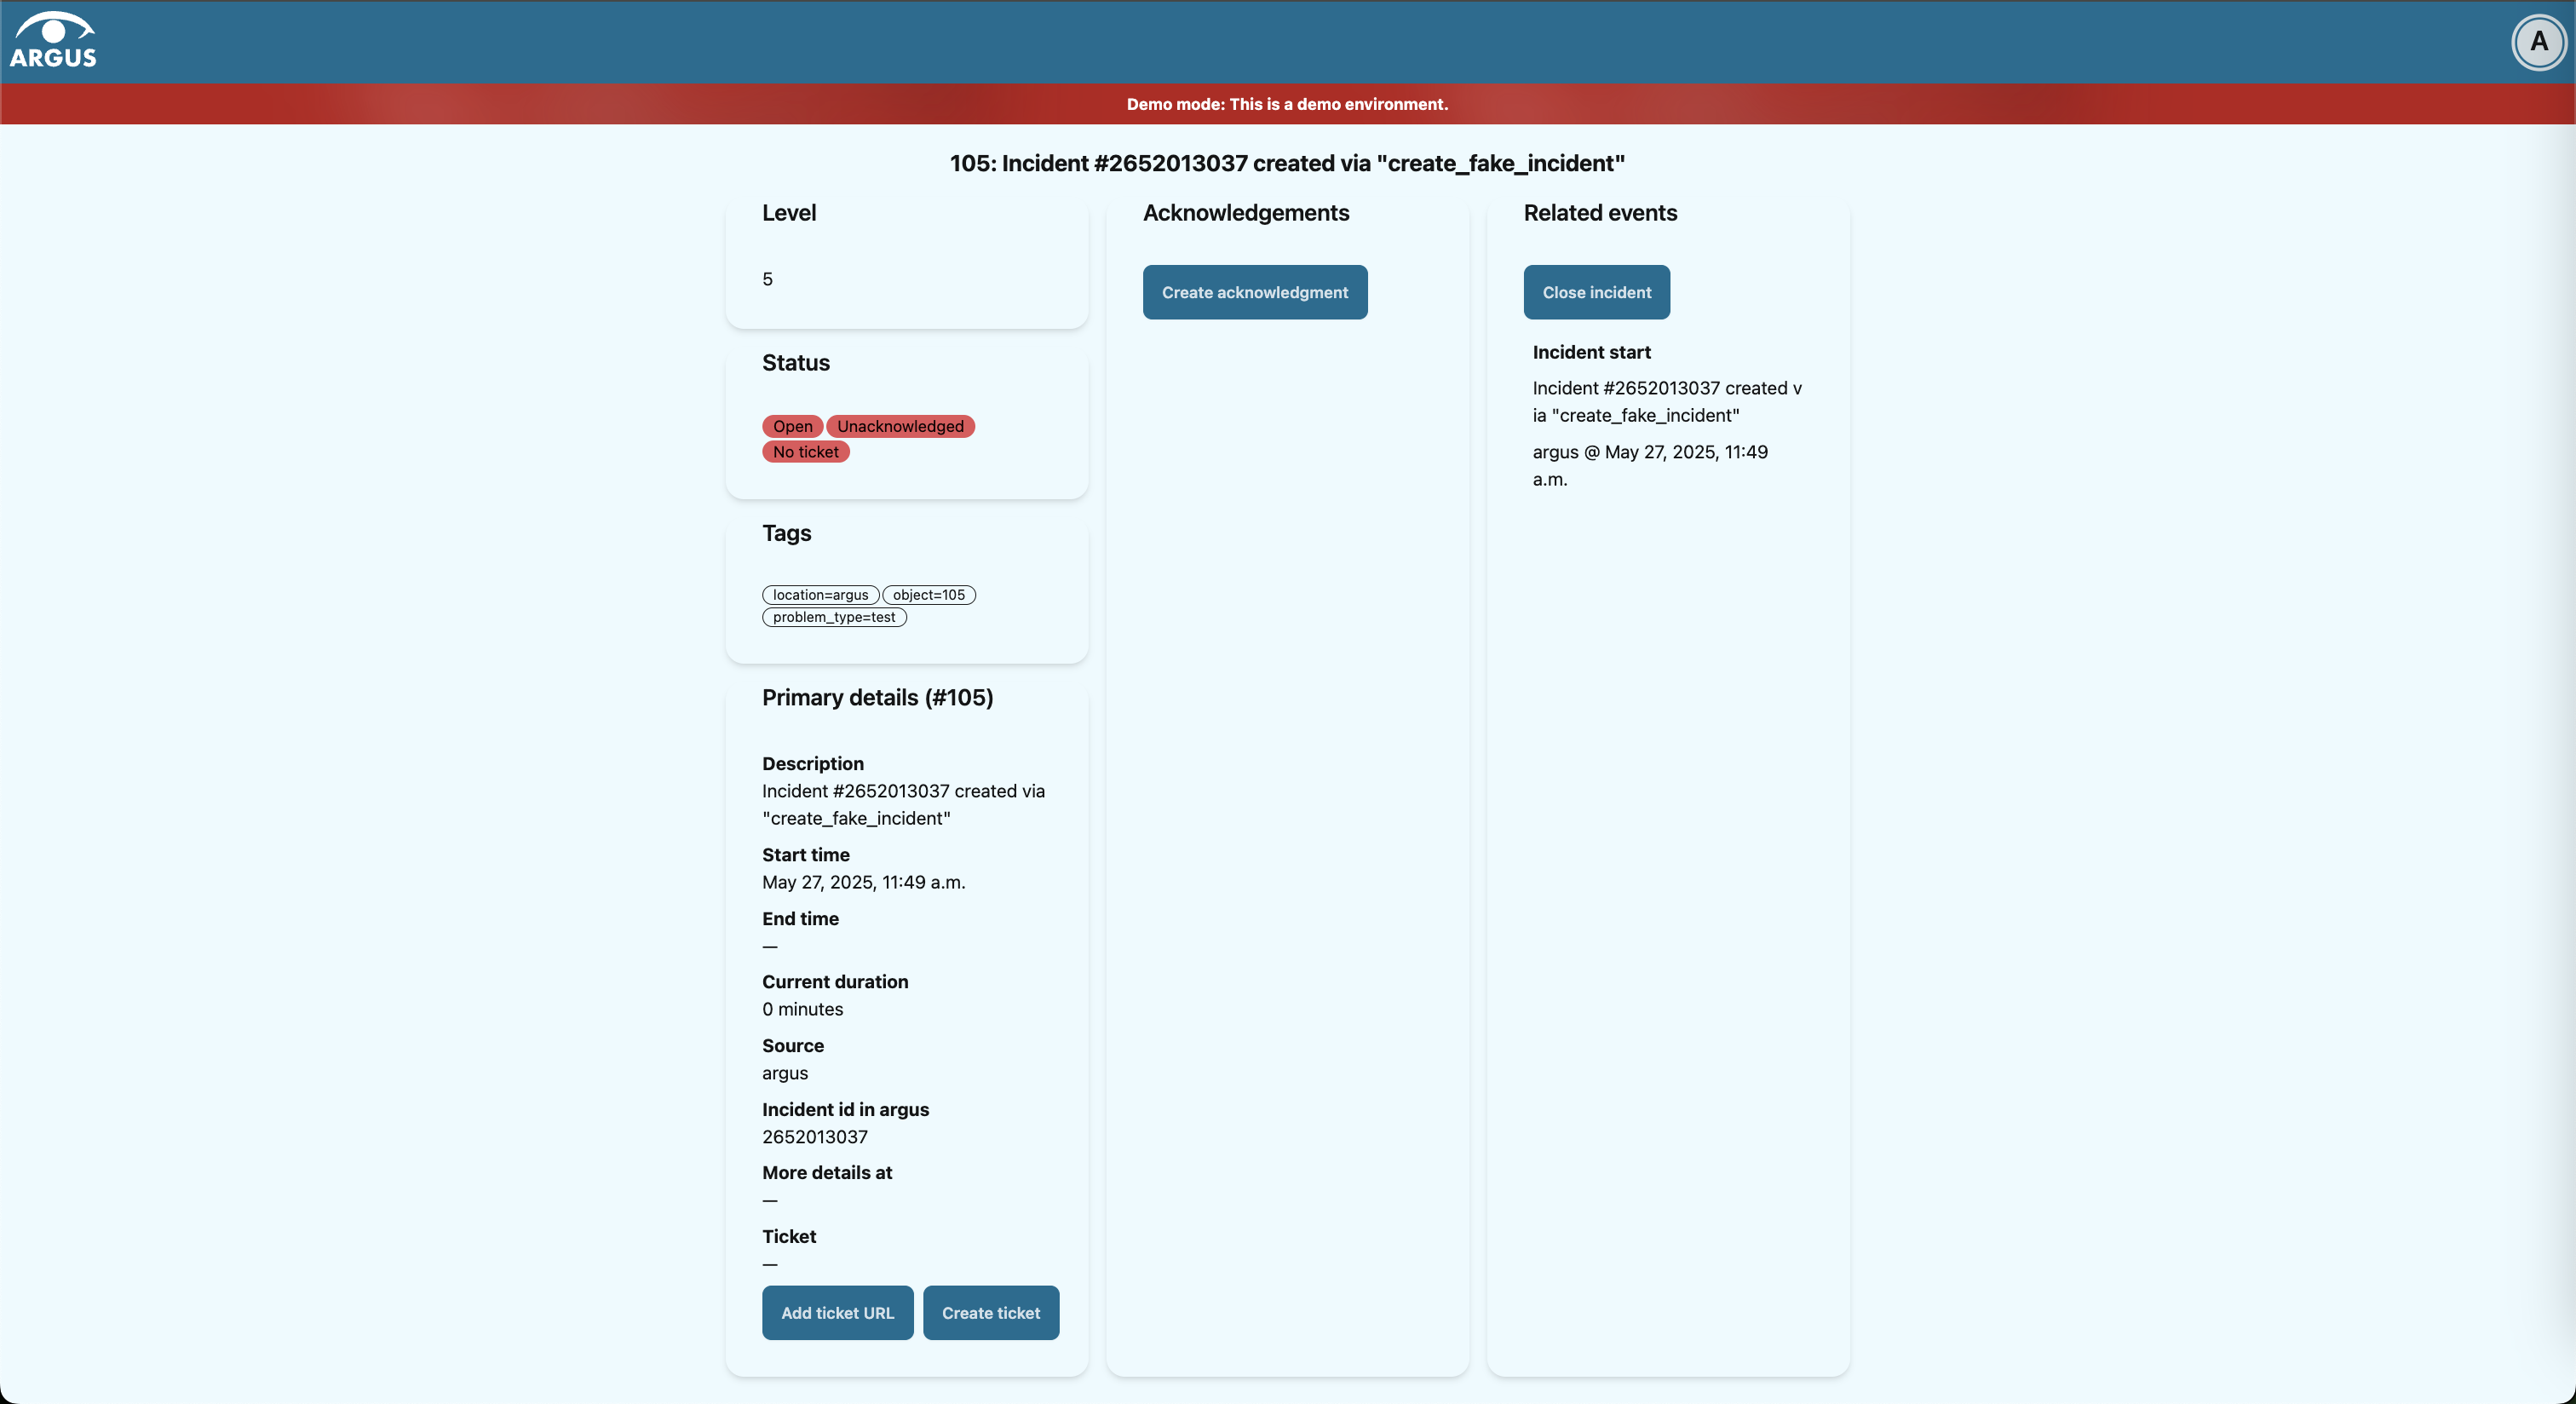
Each incident has a description (created by the monitoring system), start time, duration, source (which monitoring system it came from), tags and severity level. An incident may have end time, ticket url (associated ticket in an external ticket system). Incidents may have different status. For example, an incident may be open, or closed (resolved). An incident may also be acknowledged (noticed or commented in any way), or not. In the detailed incident view below you can get familiar with the above-mentioned attributes of an incident. Note that an incident’s event feed is also available in the detailed view. The event feed shows events like closing (resolving), and acknowledgment of an incident.
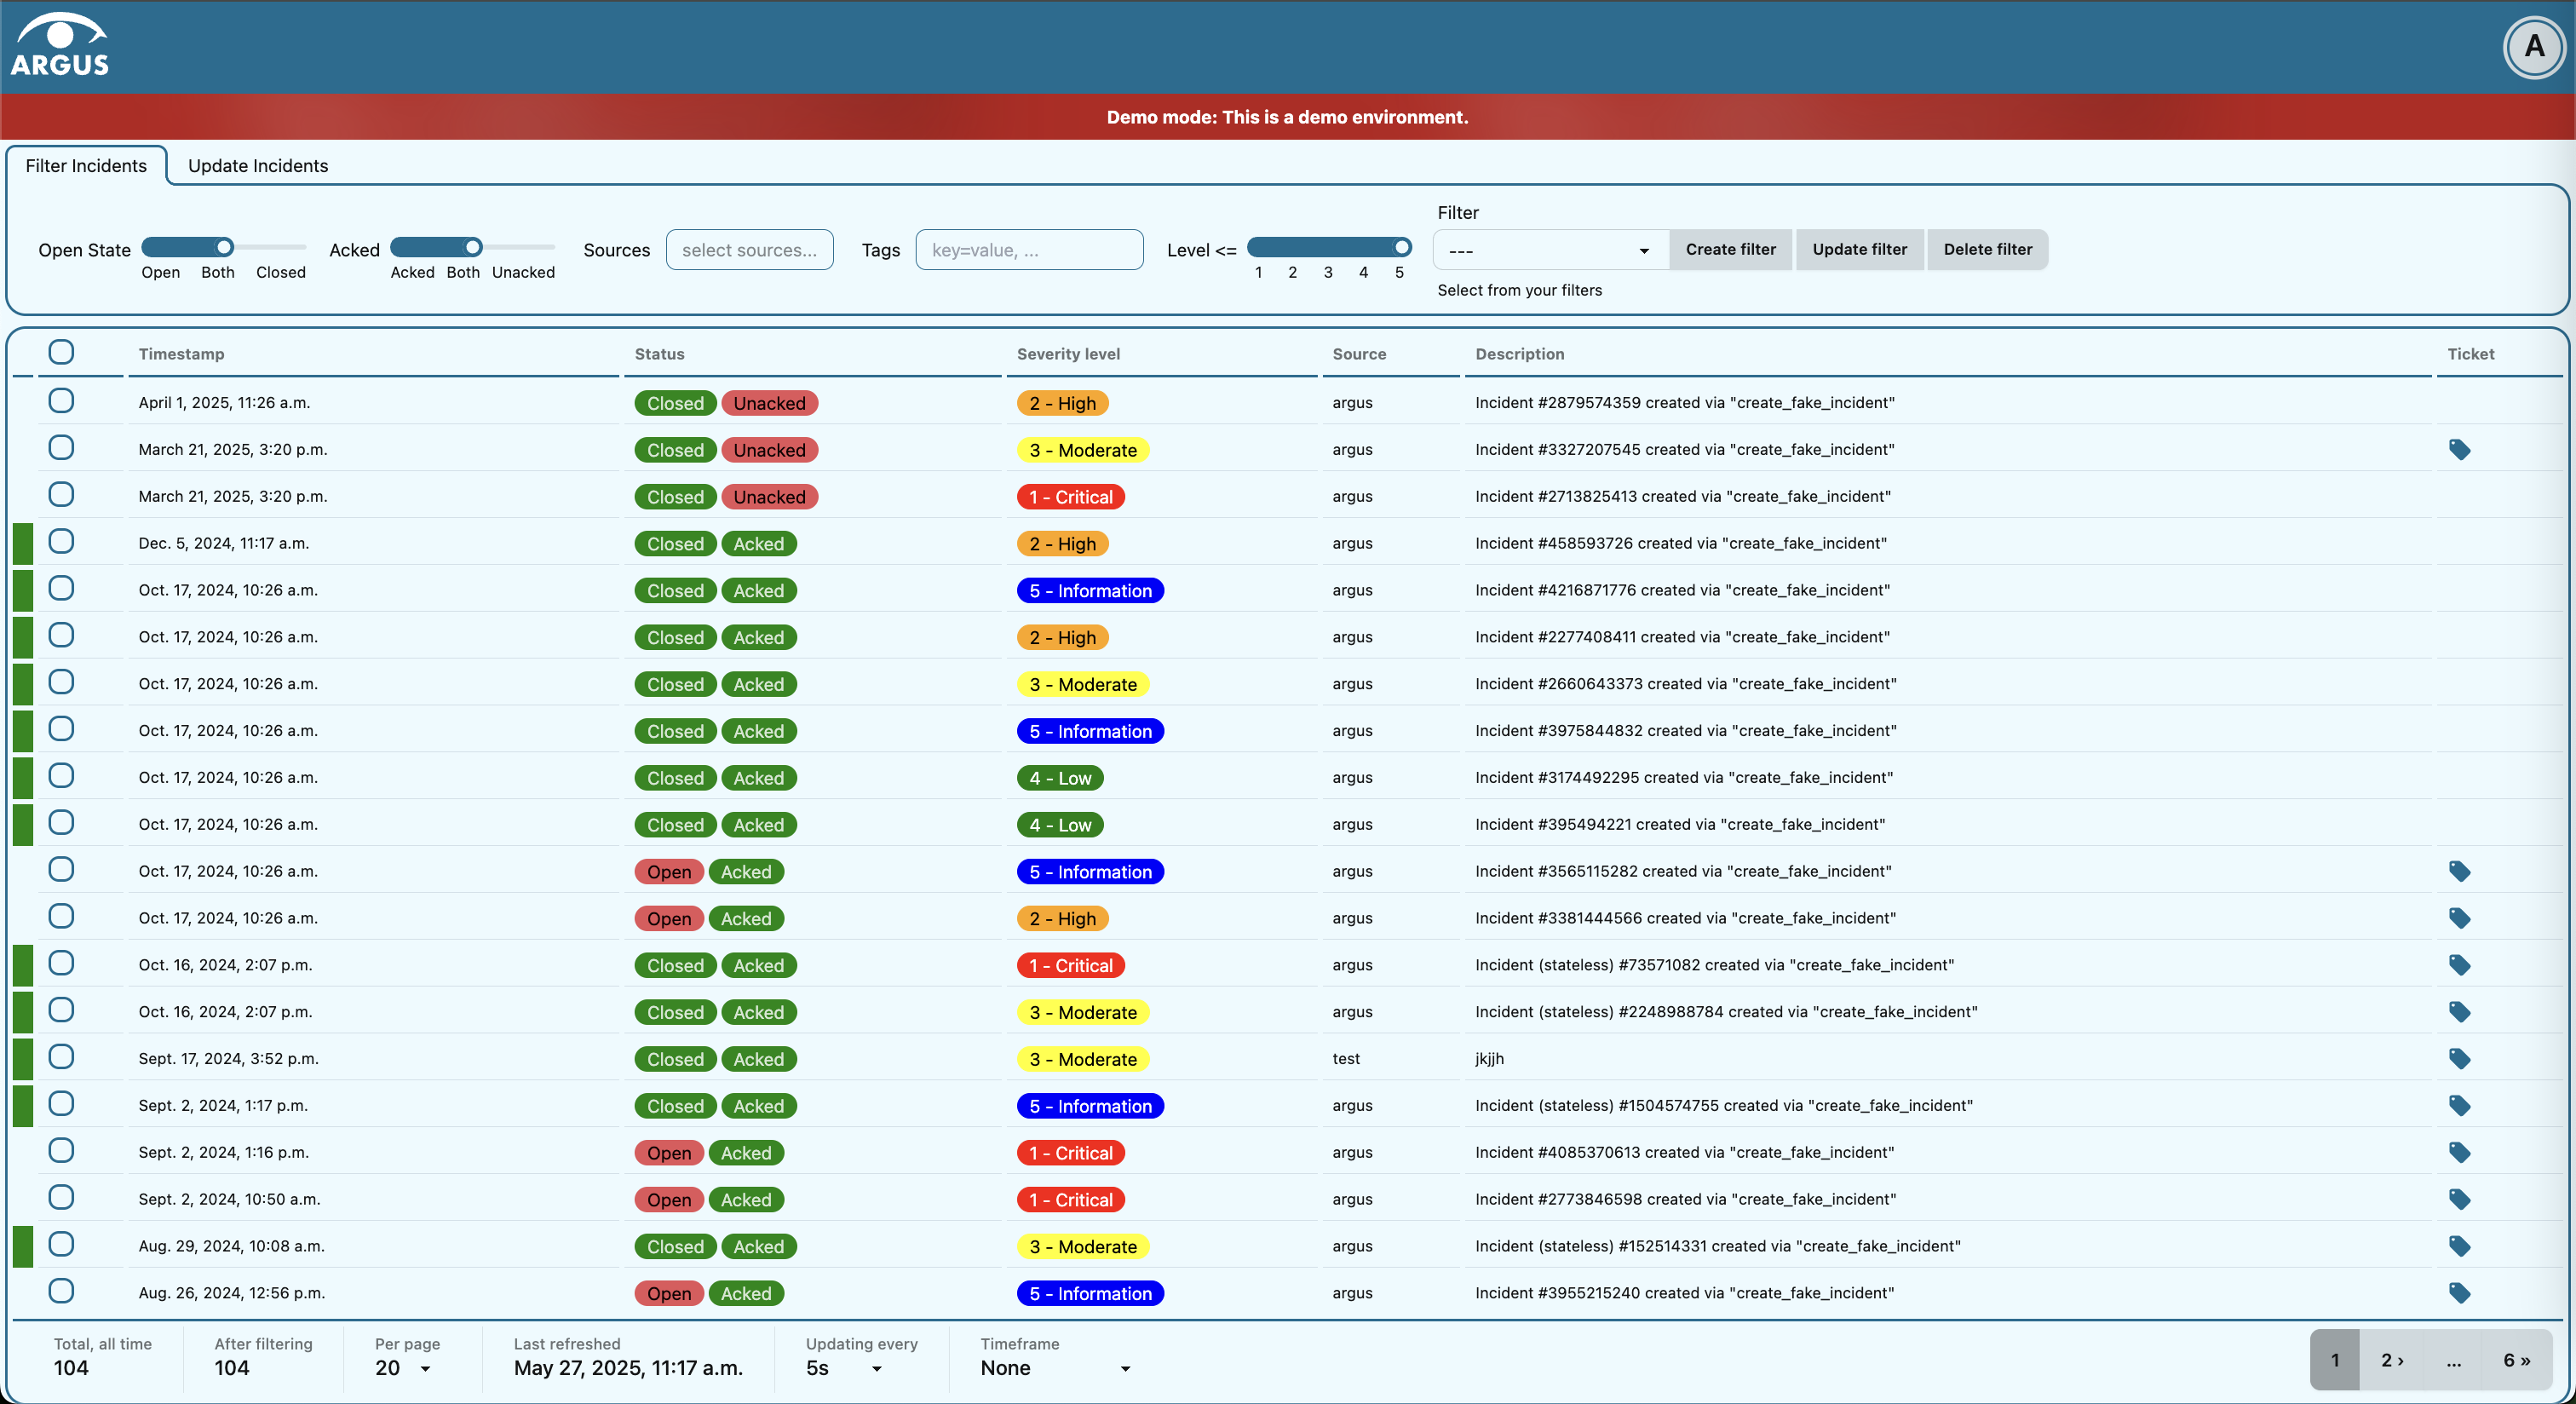
Each row in the Incidents table is one alarm. In the table you can see an incident’s start time, closed/open status, whether an incident has at least one acknowledgement, severity level, source (which monitoring system the incident came from), description (created by the monitoring system) and whether the incident has an associated ticket url (label icon at the very end of the row).
Access detailed incident view
Click on an incident row in the Incidents table.
App will redirect you to the incident’s page.
Work with incidents table
Change how many rows are shown per incidents table page
Scroll down to the bottom of the Incidents table.
Click on the Per page drop-down.
Select how many incidents per page you want displayed.
Change how often the incidents table gets refreshed
Scroll down to the bottom of the Incidents table.
Click on the Updating every drop-down.
Select how often you want the incidents to be updated.
Decide which incidents are shown in the table
You can filter incidents so that only incidents that match all preferred parameters are shown in the Incidents table.
Apply the preferred filter by using the Filter incidents toolbar. Argus will remember your filter settings from the last login session, and will use those until you change them.
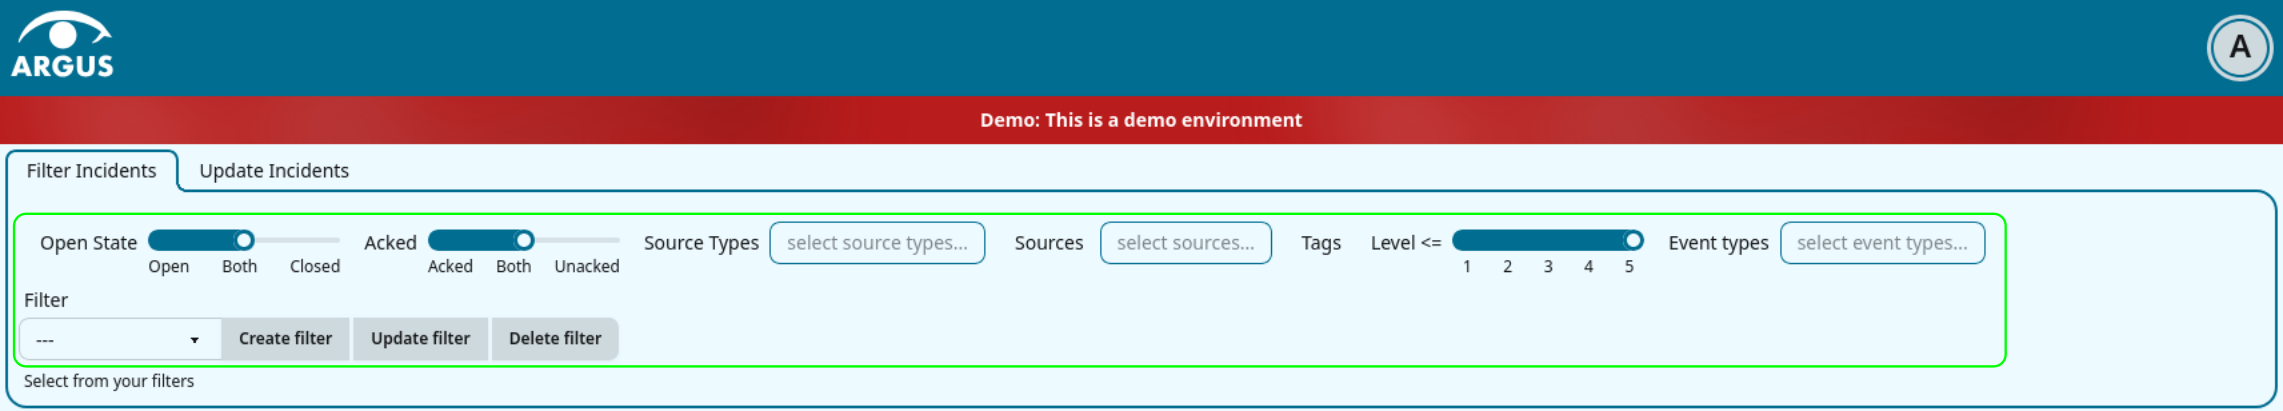
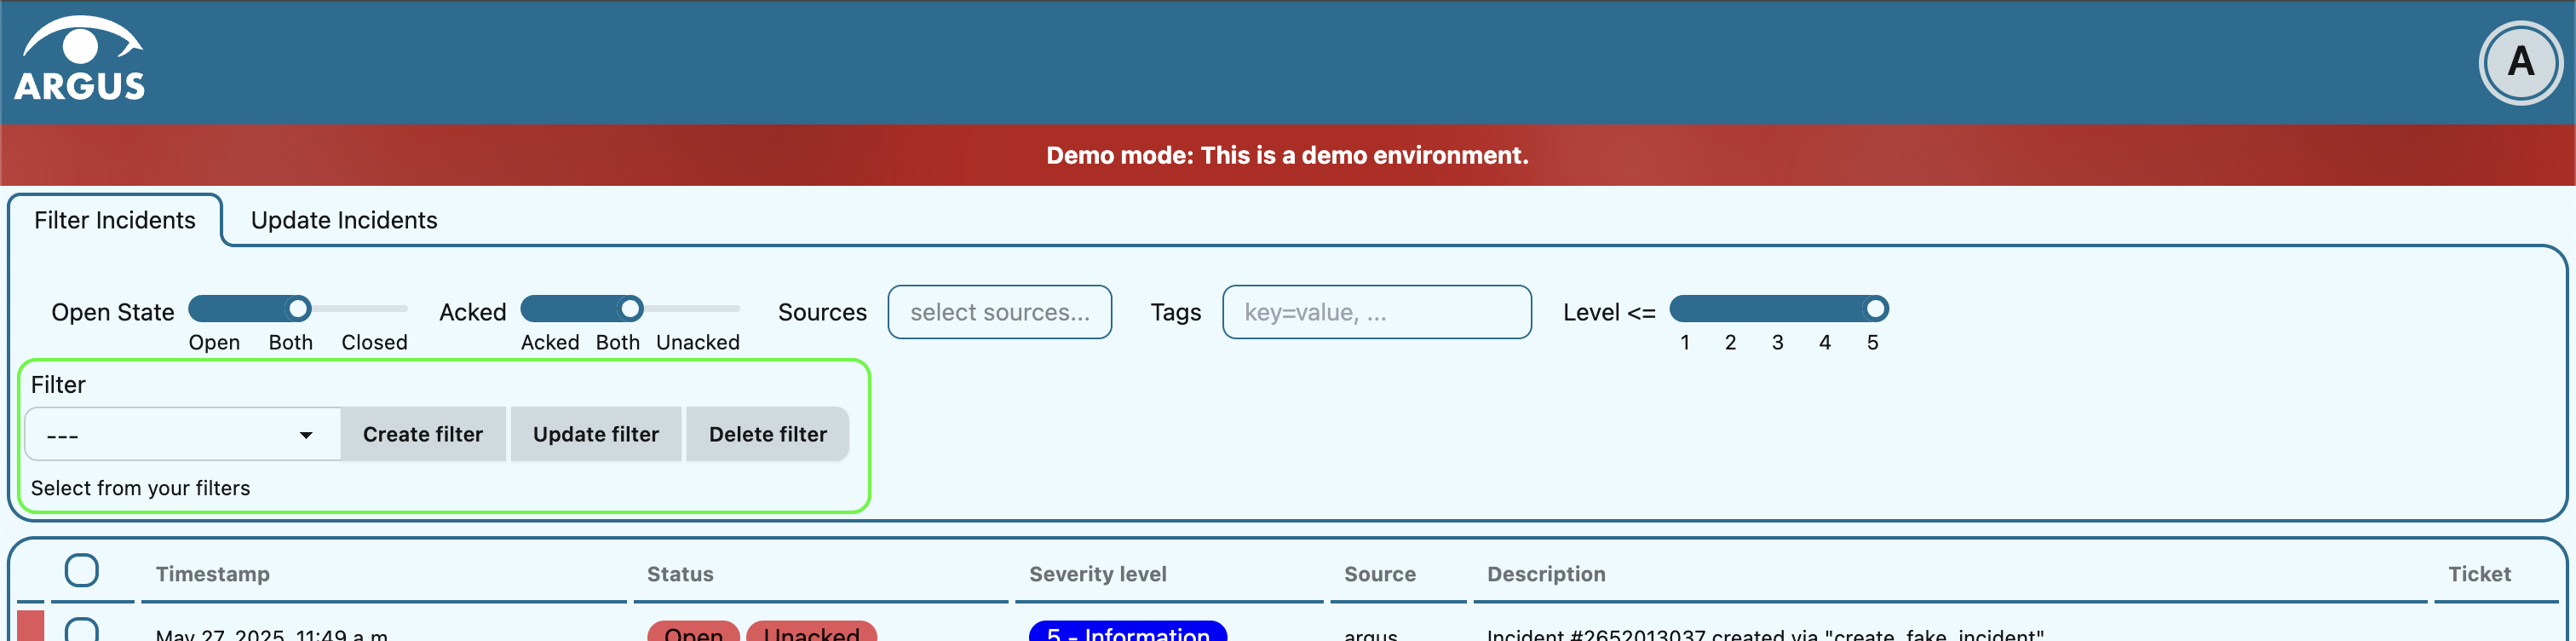
Filter incidents toolbar is available below the header in full-screen view:
Filter by open/close status
If you only want open incidents to be displayed in the table, select
Openin the Open State slider.If you only want closed (resolved) incidents to be displayed in the table, select
Closedin the Open State slider.If you want both open and closed (resolved) incidents to be displayed in the table, select
Bothin the Open State slider.
Filter by acknowledgement status
If you only want acknowledged incidents to be displayed in the table, select
Ackedin the Acked slider.If you only want unacknowledged incidents to be displayed in the table, select
Unackedin the Acked slider.If you want both acknowledged and unacknowledged incidents to be displayed in the table, select
Bothin the Acked slider.
Filter by source monitoring system
Every incident has a source, and different sources report on different things. You might not need to keep an eye on all incidents from all sources.
If you want the table to display only incidents that came from a specific monitoring system(s):
Click on the Sources selector.
In the drop-down that appears, you can see all available source systems. Click on the preferred one. The newly selected source system will appear in the input field.
Repeat the process if you want to filter by several monitoring systems.
If you want the table to display incidents from any monitoring system, leave the Sources field empty.
Note
It is better to filter on either source types or sources, not both, as they affect each other.
Filter by source monitoring system type
Every source has a type. Many types have only one source, but Argus can handle types with many sources too. For instance: sensors of the same type all reporting independently of each other.
If you want the table to display only incidents that came from specific source types:
Click on the Source Types selector.
In the drop-down that appears, you can see all available source system types. Click on the preferred one. The newly selected source system type will appear in the input field.
Repeat the process if you want to filter by several monitoring system types.
If you want the table to display incidents from any monitoring system type, leave the Source Types field empty.
Note
It is better to filter on either source types or sources, not both, as they affect each other.
Filter by severity level
The severity level ranges from 1 - Critical to 5 - Information. If you select max severity level to be 5, all incidents will be displayed in the table. If you select max severity level to be 2, only incidents with severity 1 and 2 will be displayed in the table.
To change max severity level: select the preferred max severity option in the Level slider.
Filter by event types
Not all types of events are of of equal relevance. For instance: You might want to receive notfications for new incidents but don’t need to know when they are resolved, or you might want to ignore that it has been connected to a ticket. You might be curious to know which incidents were resolved automatically, and which needed to be handled by people.
If you want the table to display only incidents that have one or more specific event types:
Click on the Event Types selector.
In the drop-down that appears, you can see all available event types. Click on the preferred one. The newly selected event type will appear in the input field.
Repeat the process if you want to filter by several event types.
If you want the table to display incidents from any event type, leave the Event Types field empty.
The event types to choose from:
Incident start
When an incident started.
Incident end
Incidents that were resolved without human intervention.
Incident change
Currently used for any other tracked change to an incident: for instance if it is connected to a ticket.
Close
Incidents that were marked as closed manually by a human.
Reopen
Incidents that were manually reopened by a human after either being automatically ended or manually marked closed.
Acknowledge
A human has seen the incident and has marked it as such.
Other
Only used for testing at the moment.
Stateless
These are incidents without duration. They cannot be open or closed.
Filter out older incidents
Note that you can not save this parameter in stored filters.
Scroll down to the bottom of the Incidents table.
Click on the Timeframe drop-down.
Select the preferred option of report-time-not-later-than for the incidents in the table.
Work with stored filters
After you have set the preferred filter parameters for incidents, you can save your preferences as a filter. Stored filters can be used when customizing alarm notifications.
You can save, modify, apply, unselect and delete filters in the Filter selector in the Filter incidents toolbar:
Save current filter
Click on the Create filter button within the Filter selector.
Give a (meaningful) name to your filter. Press
Submit. Note that you can not edit a filter’s name after it is created.
Modify existing filter
Click on the Update filter button within the Filter selector.
In the drop-down menu that appears, click on the filter that you want to update.
Press
Yesin the confirmation dialog that appears.
Apply existing filter
Click on the Filter selector.
Click on the preferred filter in the drop-down menu.
Unselect applied filter
Click on the Filter selector.
Click on the
---option in the drop-down menu.
Delete existing filter
Click on the gears icon inside the Filter input field.
Select which filter you want to delete by clicking on the bin icon.
Confirm deletion.
Update one incident
Re-open a closed (resolved) incident
Press
Reopen incidentat the top of the Related events feed.Confirm re-opening. Note that you can provide a re-opening comment if needed.
Close (resolve) an incident
Press
Close incidentat the top of the Related events feed.Press
Close now. Note that you can provide a closing comment if needed.
Add acknowledgement to an incident
Press
Create acknowledgementat the top of the Acknowledgements feed.Provide an acknowledgement comment in the Message input field. Note that you can optionally provide a date when this acknowledgement is no longer relevant.
Press
Submit.
Update incident ticket
Manually add ticket URL to an incident
Press
Add ticket URLat the bottom of the Primary details section.Type/paste in ticket URL into the Ticket URL input field. Note that the URL has to be absolute (full website address).
Press
Add ticket.
Edit ticket URL
Press
Edit ticket URLat the bottom of the Primary details section.Type/paste in ticket URL into the Ticket URL input field and press
Edit ticket. Note that the URL has to be absolute (full website address).
Remove ticket URL from an incident
Press
Edit ticket URLat the bottom of the Primary details section.Remove URL from the Ticket URL input field and press
Edit ticket.
Automatically generate ticket
Argus supports automatic ticket generation from the incident. This feature needs additional configuration. Read more in the Argus documentation for ticket systems.
Press
Create ticketat the bottom of the Primary details section.Confirm automatic ticket generation.
When ticket is successfully generated, the Ticket field is updated with a new ticket URL.
Update several incidents at a time
Re-open closed (resolved) incidents
Select several incidents in the Incidents table via checkboxes at the start of the row and press
Reopenin the Update incidents toolbar that appears above the Incidents table.Press
Reopen now. Note that you can provide a re-opening comment if needed that will be applied to all selected incidents.
Close (resolve) incidents
Select several incidents in the Incidents table via checkboxes at the start of the row and press
Closein the Update incidents toolbar that appears above the Incidents table.Press
Close now. Note that you can provide a closing comment if needed that will be applied to all selected incidents.
Add acknowledgement to incidents
Select several incidents in the Incidents table via checkboxes at the start of the row and press
Acknowledgein the Update incidents toolbar that appears above the Incidents table.Provide an acknowledgement comment in the Message input field that will be applied to all selected incidents. Note that you can optionally provide a date when these acknowledgements are no longer relevant.
Press
Submit.
Add ticket URL to incidents
Select several incidents in the Incidents table via checkboxes at the start of the row and press
Change ticketin the Update incidents toolbar that appears above the Incidents table.Type/paste in ticket URL into the Ticket URL input field and press
Submit. Note that the URL has to be absolute (full website address).
Edit ticket URL for several incidents
Same process as adding ticket URL to incidents.
Remove ticket URL from incidents
Select several incidents in the Incidents table via checkboxes at the start of the row and press
Change ticketin the Update incidents toolbar that appears above the Incidents table.Leave the Ticket URL input field empty and press
Submit.
Customize alarm notifications in Argus
Choose when, where and what alarm notifications you want to receive by creating, editing and deleting notification profiles.
About components of notification profiles
Timeslot
Timeslot allows you to customize when you want to receive the alarm notifications. You can choose one timeslot per notification profile. Timeslots are reusable across multiple notification profiles.
Filter
Filter allows you to customize what alarms (incidents) you want to receive the notifications about. Filters are reusable across multiple notification profiles.
You can choose multiple filters per notification profile. They are combined to increase precision. You cannot use one profile for sufficiently different types of incidents.
For instance, if an incident may only ever have one tag that
starts with hostname=, then having a profile with multiple
filters, each asking for different hostnames, will never be able
to match anything.
If you need to match multiple hostname tags in a profile, make a filter that only matches hostnames and include that filter in the profile.
Destination
Destination allows you to customize where you want to receive the alarm notifications. You can choose multiple destinations per notification profile. Destinations are reusable across multiple notification profiles. Destinations may be of different media types.
About the available notification media
The notification media that are available in Argus by default are:
SMS
Email
If you wish to receive notifications to other media, read about configurable media types in the Argus documentation for notification plugins.
Access your notification profiles
Press
Profilesin the Notification config section.
Add new notification profile
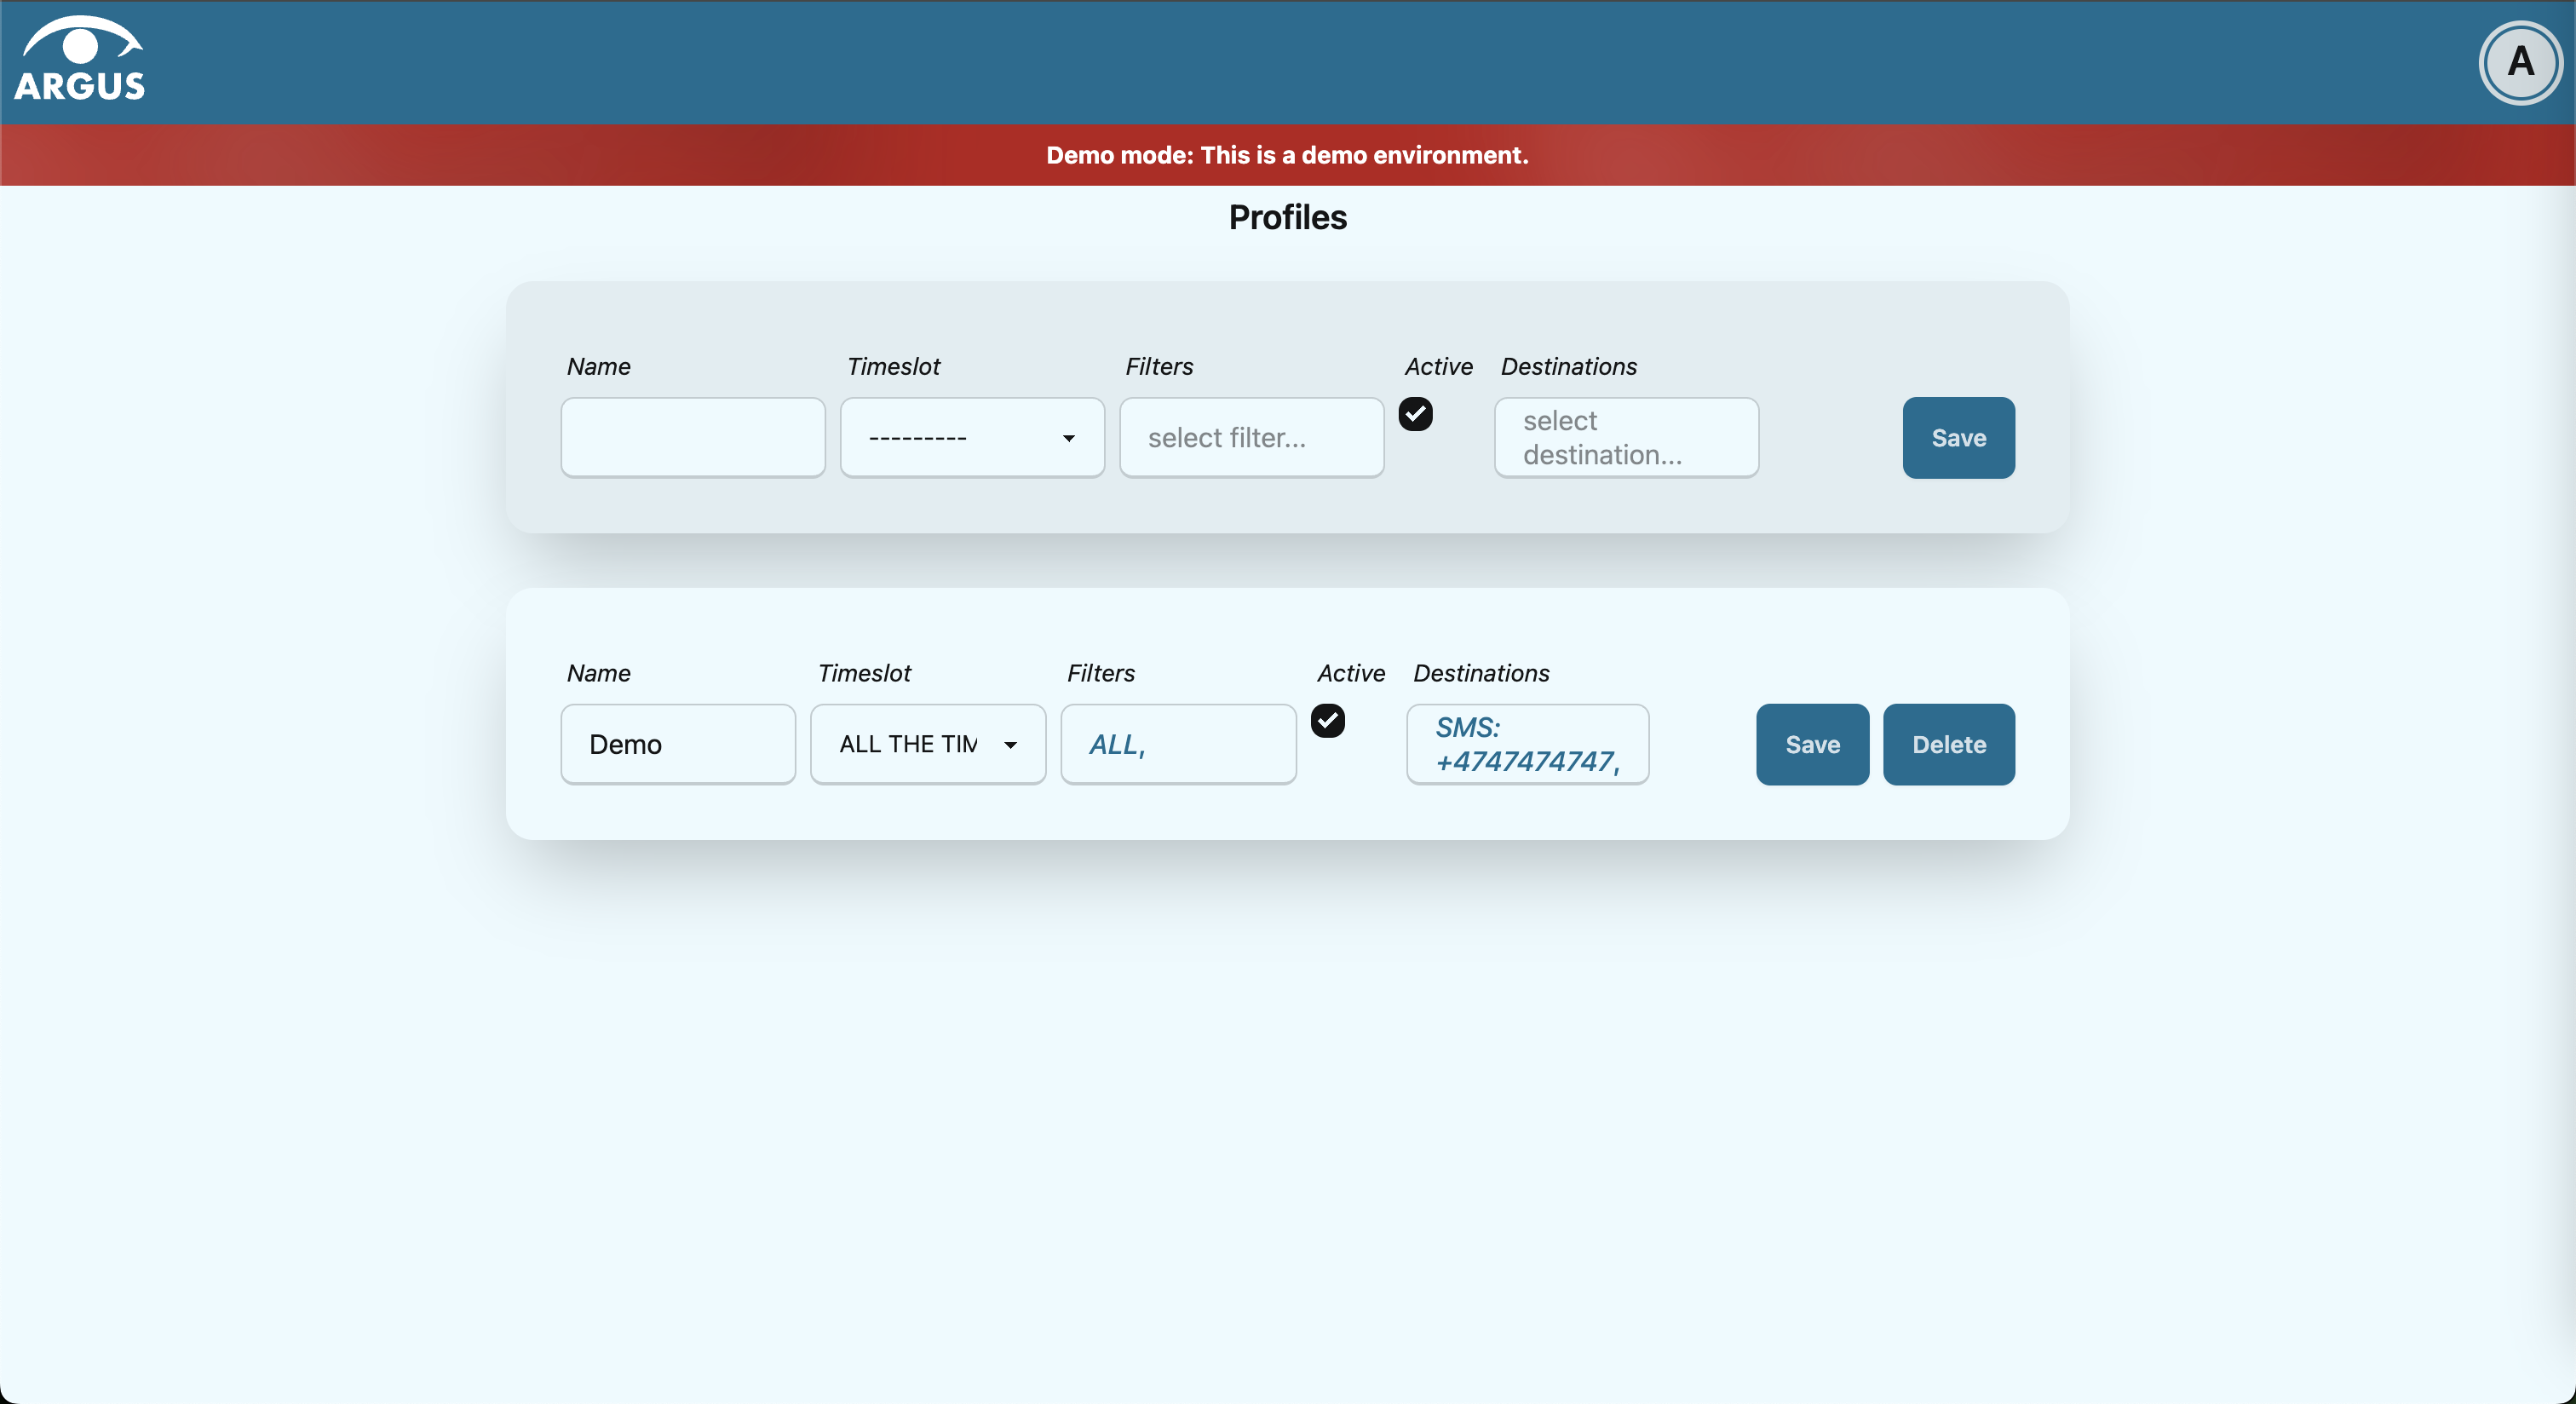
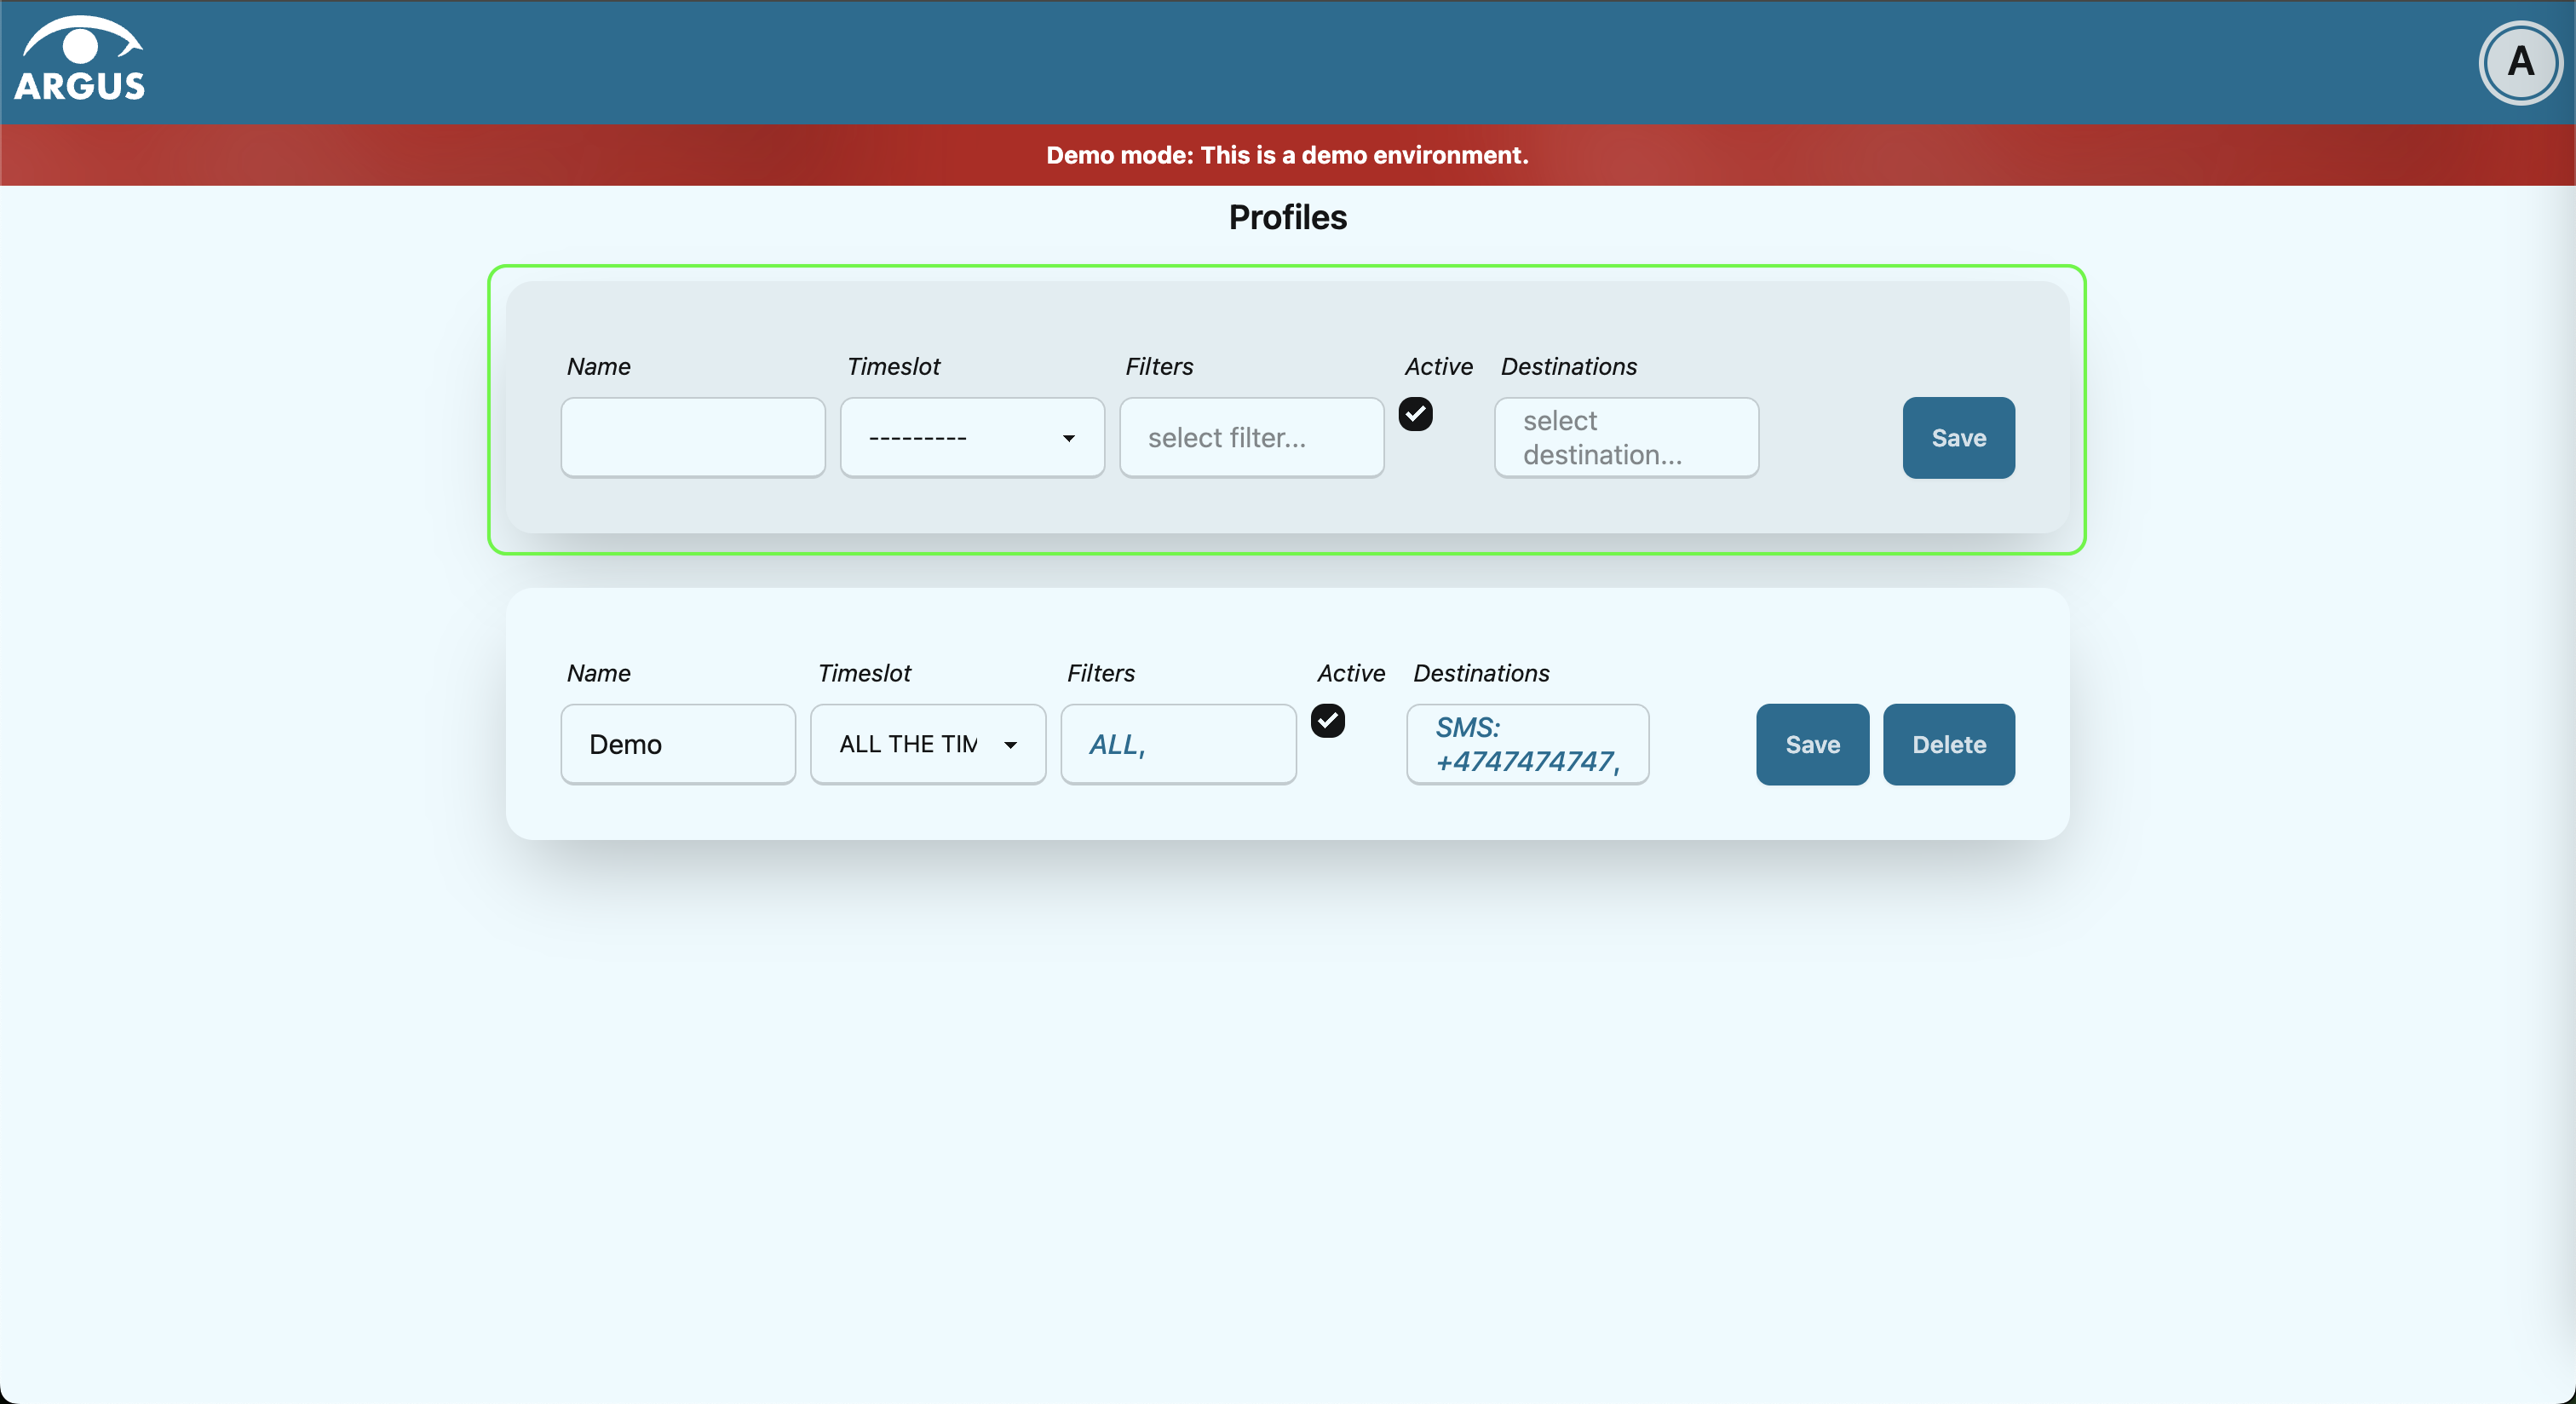
Start modifying the fields in the New Notification Profile box at the top of the page:
Type in a (meaningful) name for your notification profile in the Name input field.
Select a timeslot for when to receive notifications in the Timeslot drop-down. If the drop-down menu is empty, create a timeslot first.
Select what alarms you want to receive notifications about in the Filters drop-down. If the drop-down menu is empty, create a filter first. Note that if no filter is selected no notifications will be sent. You can select multiple filters per notification profile.
Select what destination(s) you want to receive notifications to in the Destinations drop-down. If the drop-down menu is empty, create a new destination first.
Press
Save.
Edit existing notification profile
Change the name of the notification profile in the Name input field (if needed).
Change a timeslot for when to receive notifications in the Timeslot drop-down (if needed).
Change what alarms you want to receive notifications about in the Filters drop-down (if needed).
Change what destinations(s) you want to receive notifications to in the Destinations drop-down (if needed).
Press
Save.
Disable notification profile
Uncheck the Active checkbox inside one of your existing notification profiles.
Press
Save.
Delete notification profile
Press
Deleteinside one of your existing notification profiles.
Manage when to receive notifications in Argus
Add, edit or delete timeslots in Timeslots.
What is a timeslot in Argus
A timeslot is a collection of one or more recurrences with a meaningful name. Saved timeslots can be used when customizing alarm notifications. Each timeslot represents a window (or several windows) of time for when it is OK to receive alarm notifications.
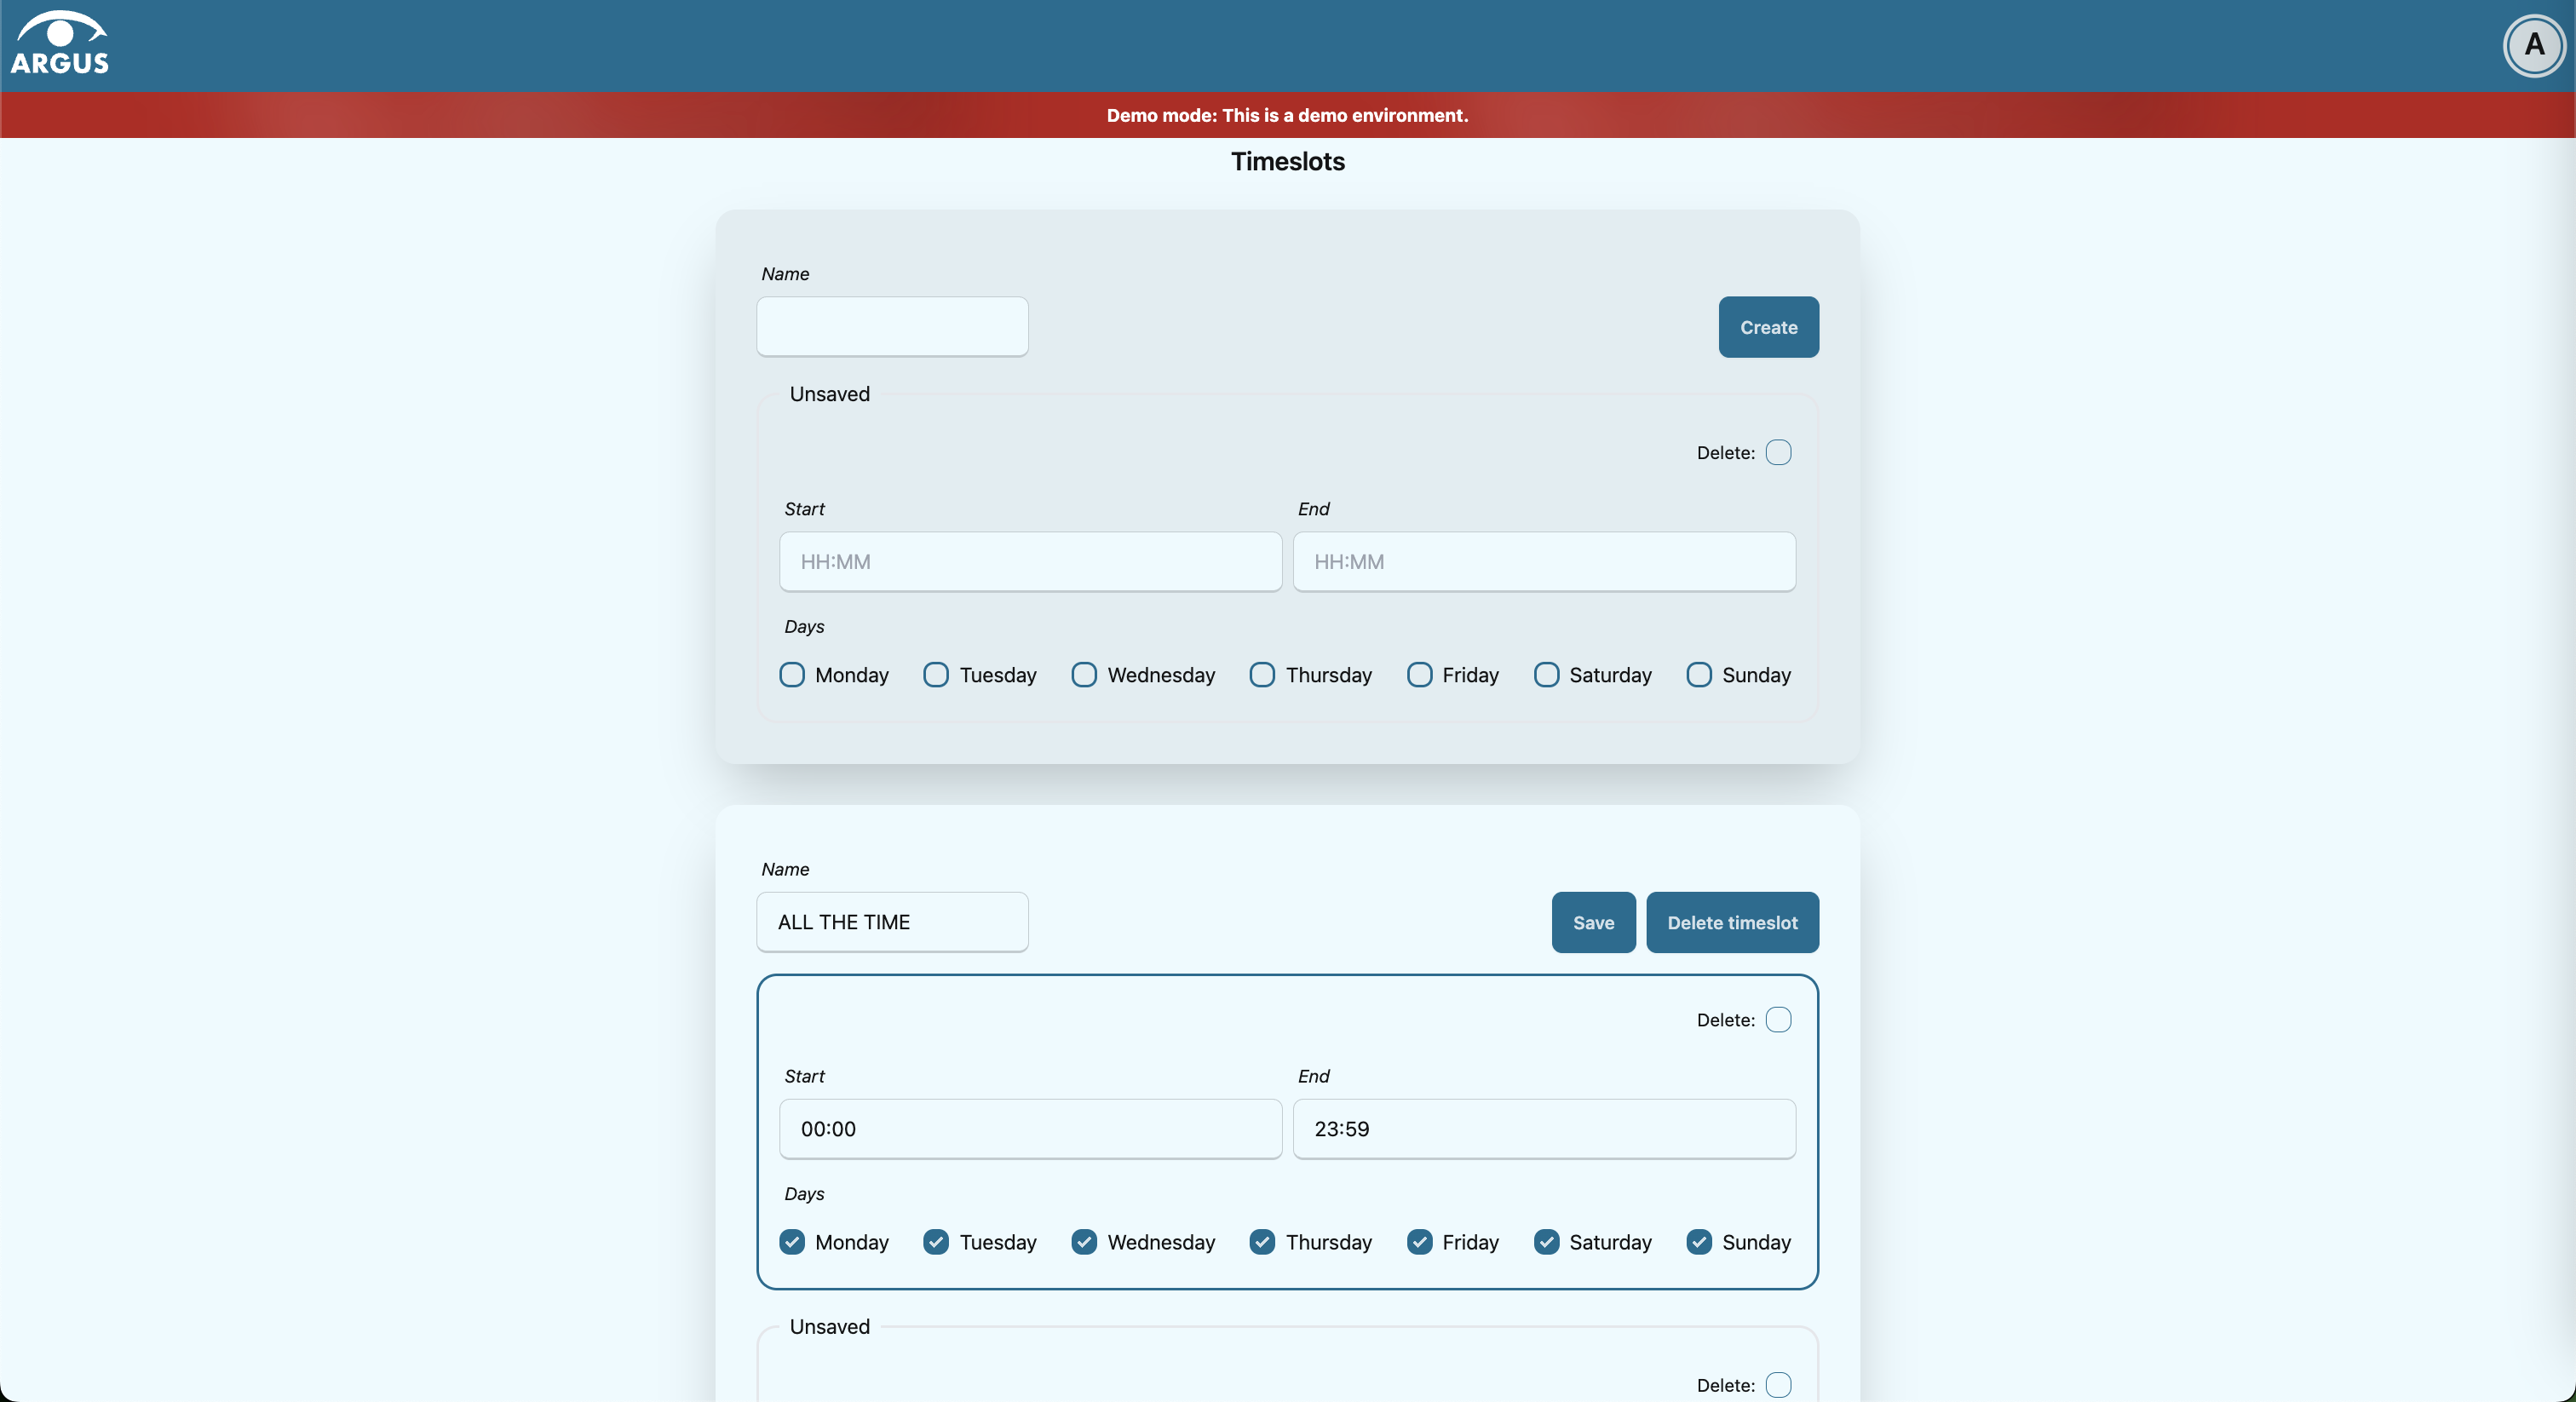
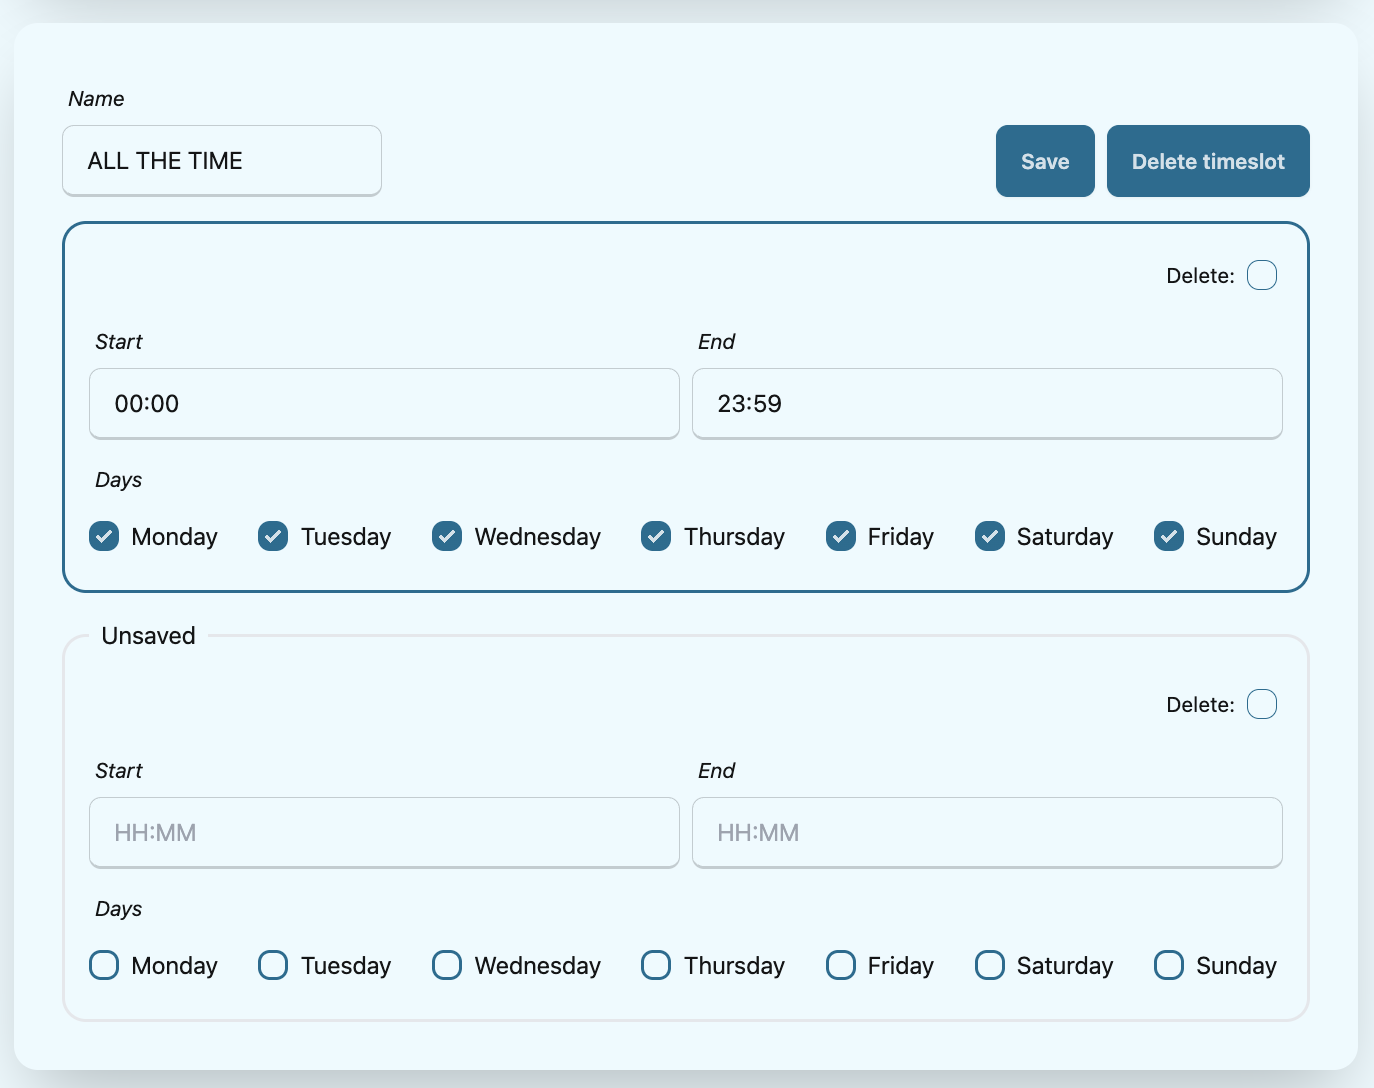
Note that every user has the default timeslot All the time:
What is a recurrence in Argus
Recurrences are building blocks for timeslots. Each recurrence represents a time range on selected weekdays for when it is OK to receive alarm notifications. A time range can either be:
a whole day,
or a window of time
Each recurrence has only one time range, and it applies to all days that are selected in a given recurrence.
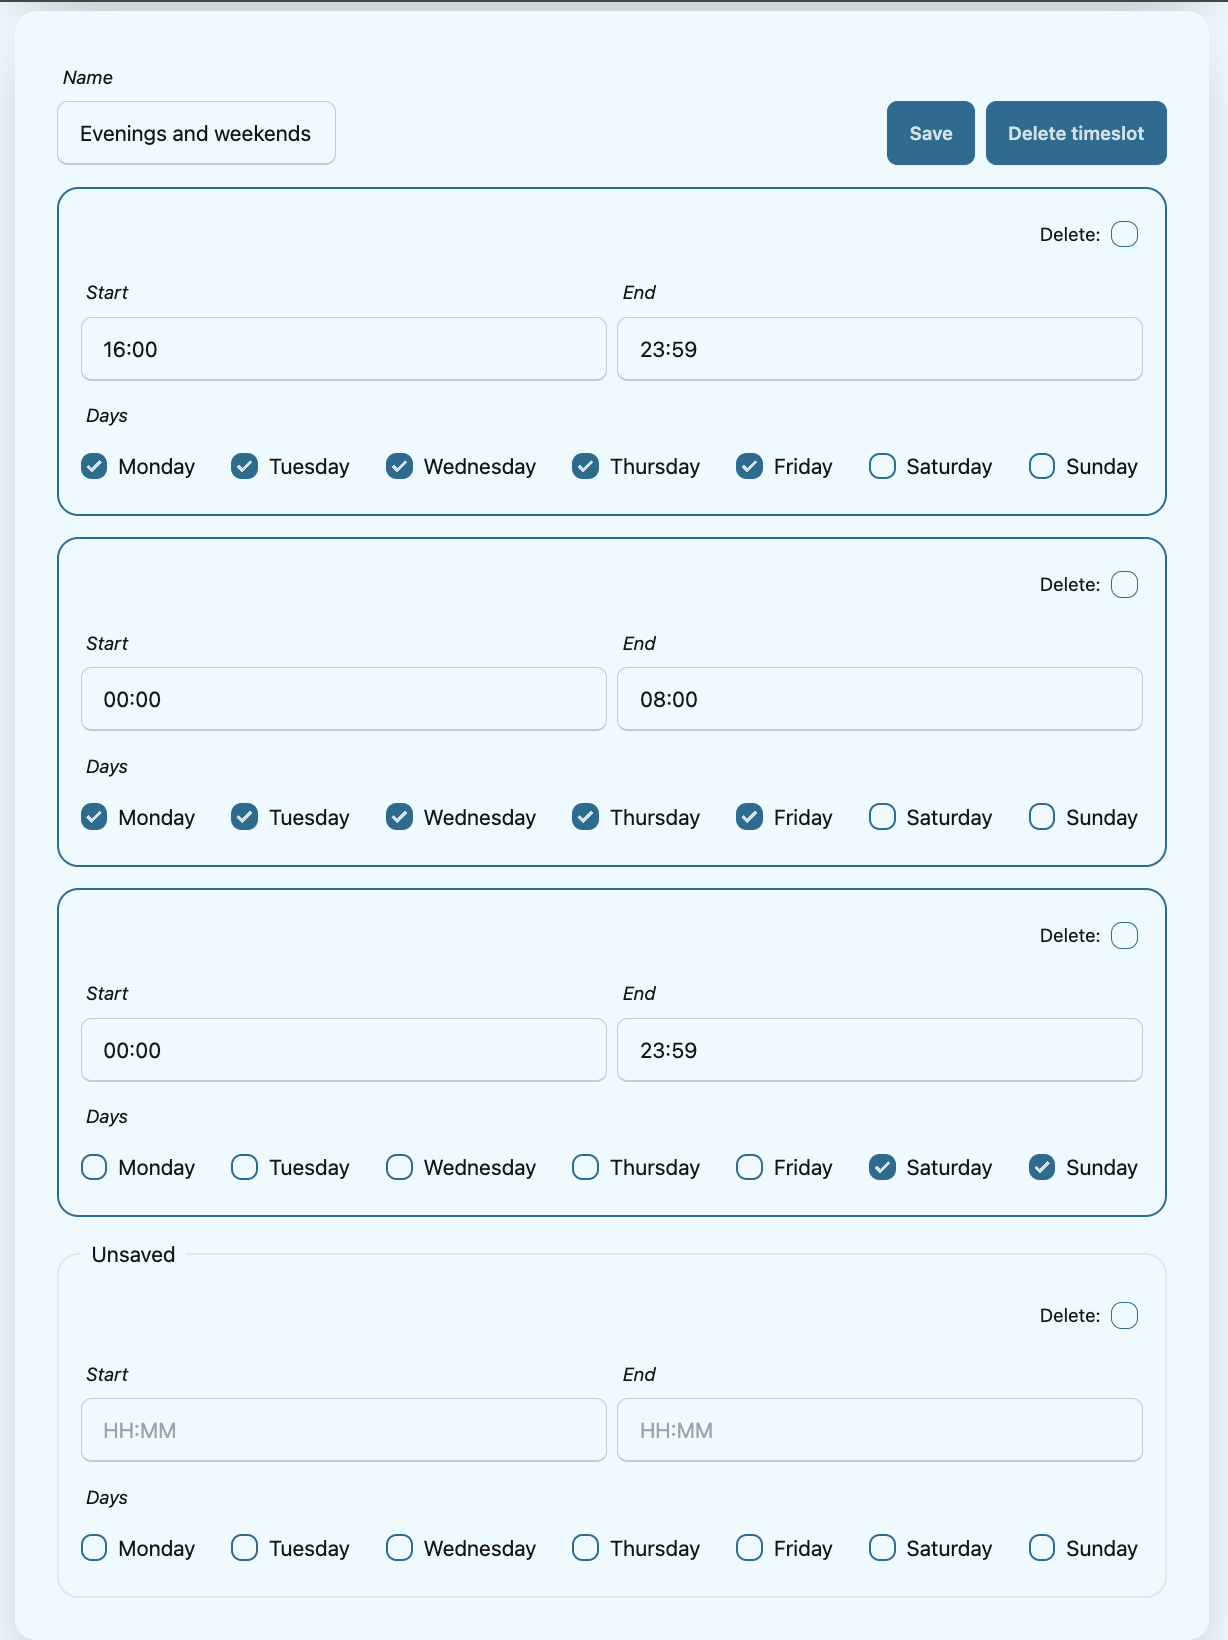
For example, in this timeslot with 3 recurrences, alarm notifications are allowed from 4 p.m. to 8 a.m. on business days (note that it is not possible to have a recurrence that goes from one day to the next), and all hours on weekends:
Access your timeslots
Press
Timeslotsin the Notification config section.
Add new recurrence
Each timeslot must have at least one recurrence. Add more recurrences if your timeslot needs more than one.
Modify the
Unsavedrecurrence either in the Create New Timeslot box, or in one of your existing timeslots: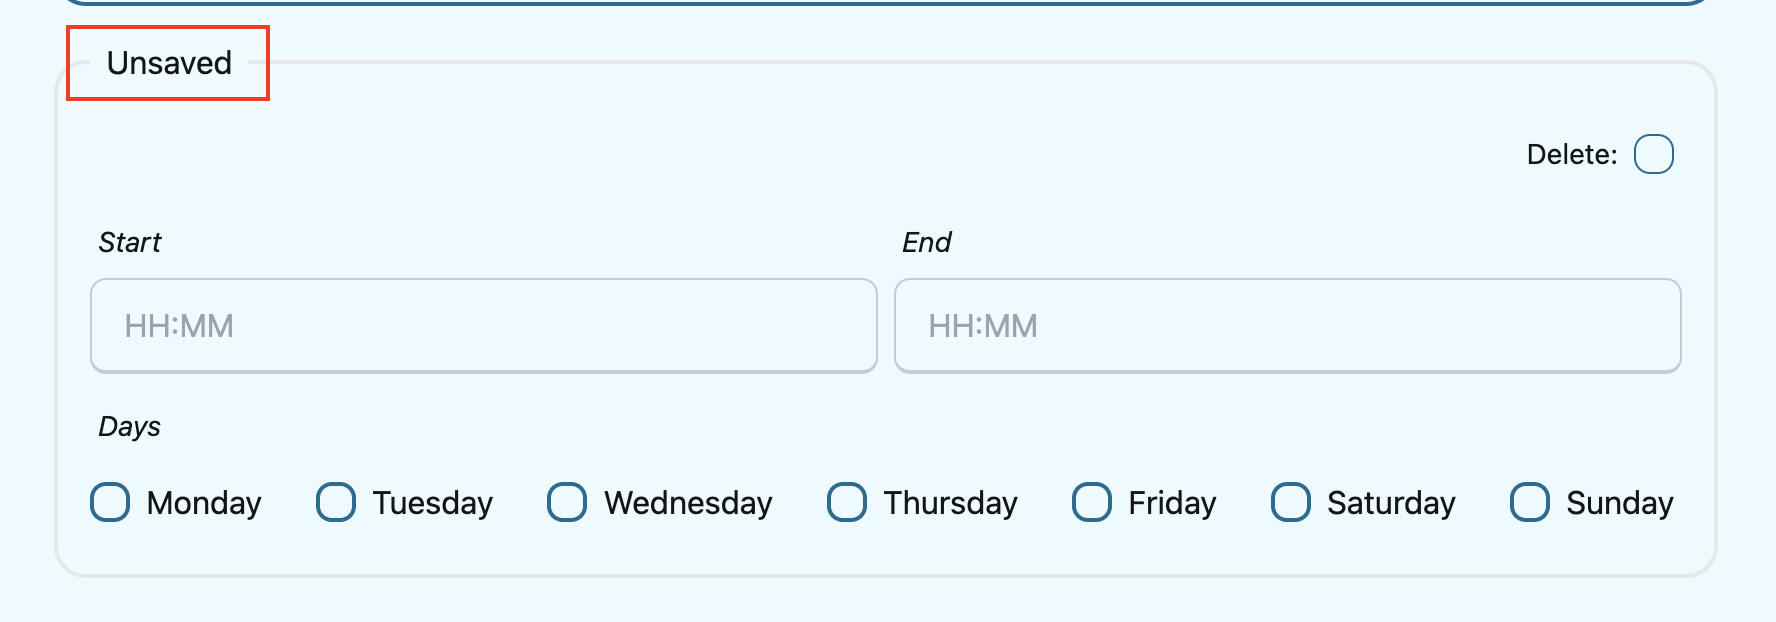
Press
Createif it is a new timeslot, orSaveif it is an existing timeslot.
Edit recurrence
Modify one of the existing recurrences either in the Create New Timeslot box, or in one of your existing timeslots:
If needed, change start time by typing a new value in format
HH:MM(24-hour format).If needed, change end time by typing a new value in format
HH:MM(24-hour format). Note that the end time must be later than the start time. If you want to have a recurrence that goes from one day to the next, you need to create two separate recurrences.Select day(s) via corresponding checkboxes.
Delete recurrence
Check the Delete checkbox in the top right corner inside one of the existing recurrences either in the Create New Timeslot box, or inside one of your existing timeslots.
Press
Createif it is a new timeslot, orSaveif it is an existing timeslot.
Add new timeslot
- Go to the Create New Timeslot box. It is visible by default at the top of the page
and is highlighted with a darker background than the existing timeslots.
Type in a (meaningful) timeslot name.
Add another recurrence(s) if needed.
Edit recurrence(s) if needed.
Remove recurrence(s) if needed.
Press
Create.The Create New Timeslot box will refresh to default and your newly created timeslot will appear at the bottom of the timeslot list. Note that existing timeslots have a lighter background than the Create New Timeslot box.
Edit existing timeslot
Modify one of your existing timeslots:
Change the name if needed.
Add another recurrence(s) if needed.
Edit recurrence(s) if needed.
Remove recurrence(s) if needed.
Press
Save.
Delete timeslot
Press
Deleteinside one of the existing timeslots. Note that there is noDelete-button in the Create New Timeslot box.
Manage your contact details (destinations) in Argus
Add, edit or delete contact details, aka destinations, in your settings. Destinations that are present in your settings can be used when customizing alarm notifications.
In Argus, emails and phone numbers are the destinations that are configured by default. If you wish to receive notifications to other media, read about configurable media types in the Argus documentation for notification plugins.
Access your destinations in settings
Press
Destinationsin the Notification config section.
Add new destination in settings
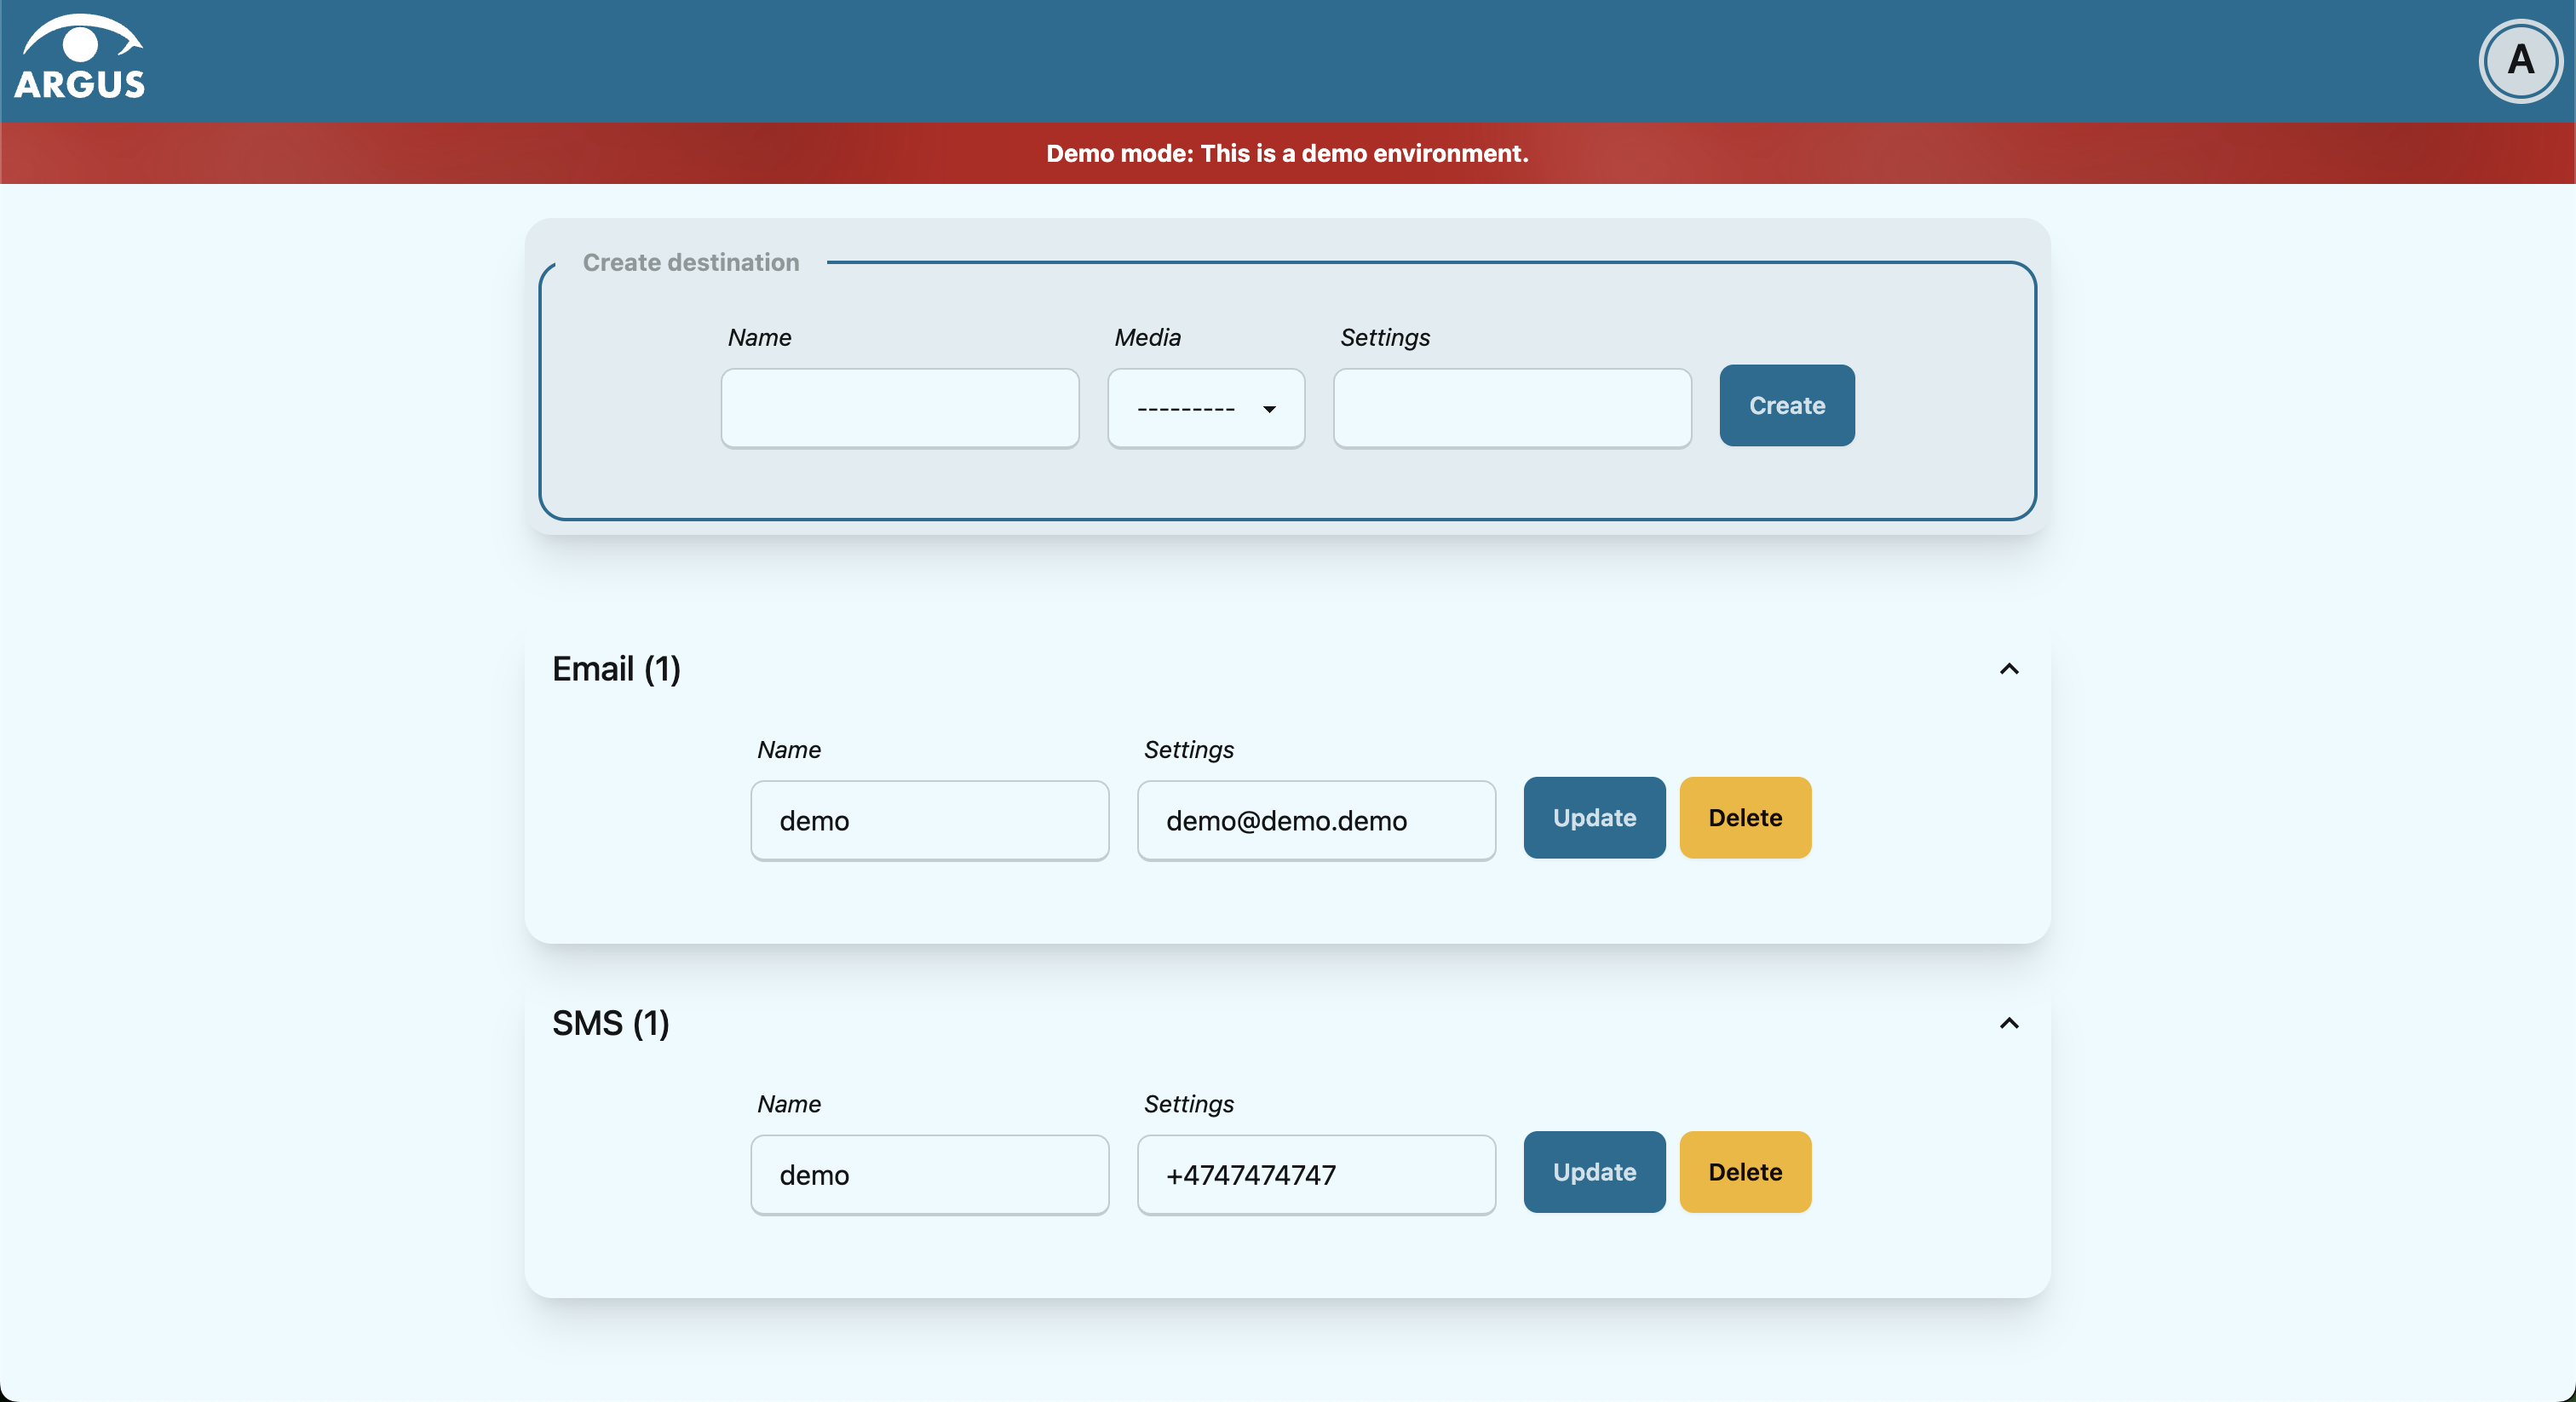
Go to the Create destination box. It is visible by default at the top of the page and is highlighted with a darker background than the existing destinations.
Select destination’s media type via the Media drop-down.
Type in a title in the Name input field (optional).
Type in a destination value in the Settings input field (required).
Press
Create.
Edit existing destination in settings
Modify one of the existing destinations (either Name or Settings value).
Press
Update.
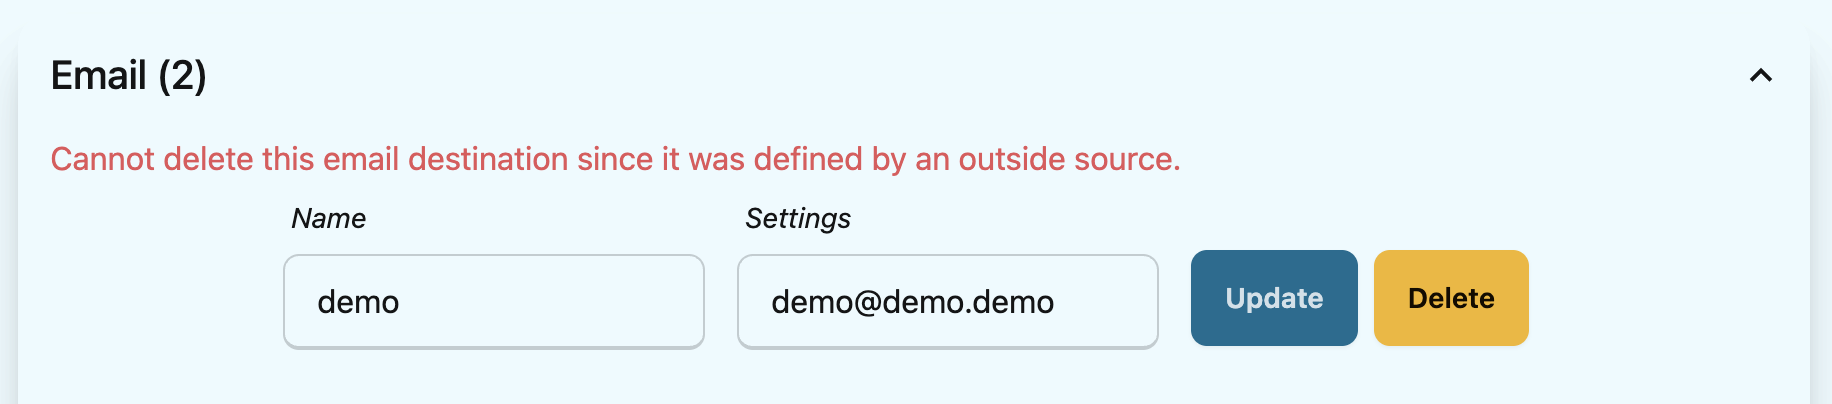
Delete destination in settings
Press
Deleteinside one of your saved destinations.
Note that some destinations are connected to your Argus user profile, and can not be deleted. In this case you will see an error message:
Log out from Argus
Press
Log out.